IBM 2010 Annual Report Download - page 21
Download and view the complete annual report
Please find page 21 of the 2010 IBM annual report below. You can navigate through the pages in the report by either clicking on the pages listed below, or by using the keyword search tool below to find specific information within the annual report.-
 1
1 -
2
-
3
-
4
-
5
-
6
-
7
-
8
-
9
-
10
-
 11
11 -
 12
12 -
 13
13 -
 14
14 -
 15
15 -
 16
16 -
 17
17 -
 18
18 -
 19
19 -
 20
20 -
 21
21 -
 22
22 -
 23
23 -
 24
24 -
 25
25 -
 26
26 -
 27
27 -
 28
28 -
 29
29 -
 30
30 -
 31
31 -
32
-
33
-
34
-
35
-
36
-
37
-
38
-
39
-
40
-
41
-
42
-
43
-
44
-
45
-
46
-
47
-
48
-
49
-
50
-
51
-
52
-
53
-
54
-
55
-
56
-
57
-
58
-
59
-
60
-
61
-
62
-
63
-
64
-
65
-
66
-
67
-
68
-
69
-
70
-
71
-
72
-
73
-
74
-
75
-
76
-
77
-
78
-
79
-
80
-
81
-
82
-
83
-
84
-
85
-
86
-
87
-
88
-
89
-
90
-
91
-
92
-
93
-
94
-
95
-
96
-
97
-
98
-
99
-
100
-
101
-
102
-
103
-
104
-
105
-
106
-
107
-
108
-
109
-
110
-
111
-
112
-
113
-
114
-
115
-
116
-
117
-
118
-
119
-
120
-
121
-
122
-
123
-
124
-
125
-
126
-
127
-
128
-
129
-
130
-
131
-
132
-
133
-
134
-
135
-
136
-
137
-
138
-
139
-
140
 |
 |

19
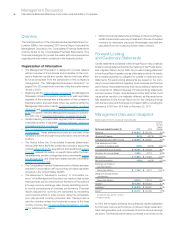
Management Discussion
International Business Machines Corporation and Subsidiary Companies
strength of the company’s global model and the results of the
strategic transformation of the business.
The company’s transformation, which started at the beginning
of the decade, has been focused on shifting the business to higher
value areas of the market, improving operating leverage through
productivity and investing in opportunities to drive future growth.
The overall changes to the business have been dramatic. Several
examples demonstrate the success of this transformation.
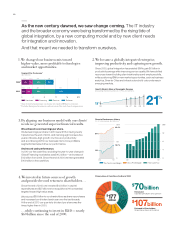
To capture the opportunity that exists in the emerging markets,
the company created a dedicated management system and
invested to drive market expansion and infrastructure development.
Since 2000, the company has added $10 billion in annual revenue
from its growth markets, and with a revenue growth rate that has
consistently exceeded the major markets, the revenue contribution
from the growth markets has increased significantly to 21 percent
of total geographic revenue in 2010.
Across the company’s portfolio, there has been a shift to higher
value areas while divesting commoditizing businesses. These
actions have contributed to a significant change in the mix of the
business. In 2000, Global Services segment pre-tax income was
$4.5 billion; in 2010, it was over $8 billion. The Software growth is
even more dramatic. In 2000, Software segment pre-tax income
was $2.8 billion; in 2010, it was over $9 billion, tripling since 2000
and now representing 44 percent of total segment pre-tax income.
At the consolidated level, since 2000, the company has added
$10 billion of pre-tax income, nearly tripled earnings per share and
generated over $162 billion in cash flow from operating activities.
The strong profit and cash generation has enabled the company
to invest in the business, while delivering significant shareholder
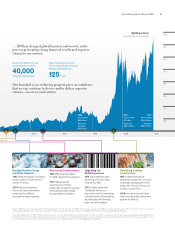
returns. In the past 10 years, the company has invested almost
$60 billion in research and development and approximately $32
billion in acquiring 116 companies, adding to its capabilities in high-
value areas like business analytics and smarter planet. From 2001-
2010, the company returned $107 billion to shareholders through
share repurchases and dividends, with almost $19 billion in 2010.
The company’s performance in 2010 marked the end of a very
successful decade. The changes that the company has made over
the last 10 years have strengthened the business and position it
well going forward.
For the year, the company delivered $11.52 in diluted earnings
per share, an increase of 15.1 percent year to year. This was the
eighth consecutive year of double-digit earnings per share growth.
In 2007, the company developed a Road Map for growth with an
earnings per share objective for 2010 of $10 to $11 per share. With
its performance in 2010, the company exceeded the low end of
its objective by $1.52 per share and the high end by $0.52 per
share. The resilience of the business model enabled the company
to exceed its objective even while managing through the severe
global recession.
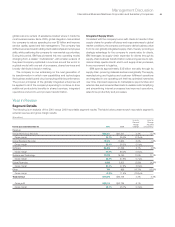
Total revenue for 2010 increased 4.3 percent (3 percent adjusted
for currency) compared to 2009; excluding the divested Product
Lifecycle Management (PLM) operations, total revenue increased
4.9 percent (4 percent adjusted for currency). Revenue from the
growth markets increased 16.0 percent (11 percent adjusted for
currency) with performance led by the BRIC countries of Brazil,
Russia, India and China which increased 18 percent, adjusted for
currency. Within the growth markets, 40 countries grew revenue
at a double-digit rate at constant currency in 2010 compared to
the prior year. Segment performance was driven by Systems and
Technology which increased 11.0 percent year to year (11 percent
adjusted for currency) and Software which increased 5.1 percent
(5 percent adjusted for currency). Software revenue, excluding
PLM, grew 8.1 percent (8 percent adjusted for currency). Within
Software, performance was led by key branded middleware
which increased 10.8 percent (11 percent adjusted for currency)
compared to the prior year. Systems and Technology revenue
growth was driven by new product introductions and very strong
performance in the growth markets which increased 20 percent
(19 percent adjusted for currency).
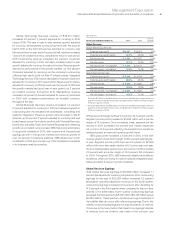
The consolidated gross profit margin increased 0.3 points
versus 2009 to 46.1 percent, reflecting the improved business mix,
operating leverage and the continued success of the company’s
productivity initiatives. This was the seventh consecutive year
of improvement in the gross profit margin. Gross profit margin
performance by segment and the impact to the consolidated gross
margin was as follows:
Gross Yr.-to-Yr. Consolidated
Margin Change Impact
Global Technology Services 34.7% (0.3) pts. (0.0) pts.
Global Business Services 28.3% 0.0 pts. 0.0 pts.
Software 86.9% 0.9 pts. 0.3 pts.
Systems and Technology 38.5% 0.7 pts. 0.0 pts.
Global Financing 51.3% 3.8 pts. 0.1 pts.
In 2010, the company continued to invest for innovation and
growth. These investments supported the introduction of the new
System z mainframe and POWER7 products and the success in
the performance of the growth markets. The company also invested
$6 billion to acquire 17 companies, adding significant new capa-
bilities to support its growth initiatives.
Total expense and other income increased 2.5 percent in 2010
versus 2009. The year-to-year drivers were approximately:
• Operational expense, (2) points
• Currency,* 1 point
• Acquisitions,** 3 points
* Reflects impacts of translation and hedging programs.
** Includes acquisitions completed in prior 12-month period.
Pre-tax income grew 8.7 percent and the pre-tax margin was 19.7
percent, an increase of 0.8 points versus 2009. Net income
increased 10.5 percent reflecting an improvement in the tax rate.
The effective tax rate was 24.8 percent, compared with 26.0
percent in the prior year. Net income margin improved 0.8 points
to 14.9 percent.
Diluted earnings per share improved 15.1 percent reflecting the
strong growth in net income and the benefits of the common stock
repurchase program. In 2010, the company repurchased approxi-
mately 118 million shares of its common stock. Diluted earnings per