IBM 2010 Annual Report Download - page 59
Download and view the complete annual report
Please find page 59 of the 2010 IBM annual report below. You can navigate through the pages in the report by either clicking on the pages listed below, or by using the keyword search tool below to find specific information within the annual report.-
 1
1 -
2
-
3
-
4
-
5
-
6
-
7
-
8
-
9
-
10
-
11
-
12
-
13
-
14
-
15
-
16
-
17
-
18
-
19
-
20
-
21
-
22
-
23
-
24
-
25
-
26
-
27
-
28
-
29
-
30
-
31
-
32
-
33
-
34
-
35
-
36
-
37
-
38
-
39
-
40
-
41
-
42
-
43
-
44
-
45
-
46
-
47
-
48
-
 49
49 -
 50
50 -
 51
51 -
 52
52 -
 53
53 -
 54
54 -
 55
55 -
 56
56 -
 57
57 -
 58
58 -
 59
59 -
 60
60 -
 61
61 -
 62
62 -
 63
63 -
 64
64 -
 65
65 -
 66
66 -
 67
67 -
 68
68 -
 69
69 -
70
-
71
-
72
-
73
-
74
-
75
-
76
-
77
-
78
-
79
-
80
-
81
-
82
-
83
-
84
-
85
-
86
-
87
-
88
-
89
-
90
-
91
-
92
-
93
-
94
-
95
-
96
-
97
-
98
-
99
-
100
-
101
-
102
-
103
-
104
-
105
-
106
-
107
-
108
-
109
-
110
-
111
-
112
-
113
-
114
-
115
-
116
-
117
-
118
-
119
-
120
-
121
-
122
-
123
-
124
-
125
-
126
-
127
-
128
-
129
-
130
-
131
-
132
-
133
-
134
-
135
-
136
-
137
-
138
-
139
-
140
 |
 |

57
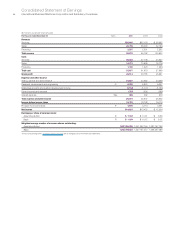
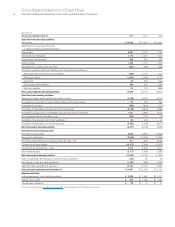
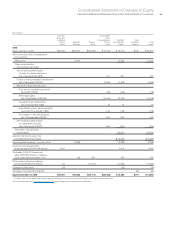
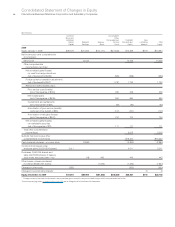
Management Discussion
International Business Machines Corporation and Subsidiary Companies
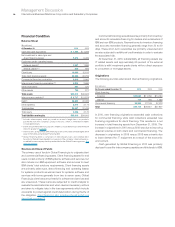
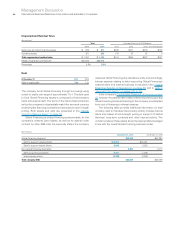
Global Financing Receivables and Allowances
The following table presents external financing receivables excluding
residual values, and the allowance for credit losses.
($ in millions)
At December 31: 2010 2009
Gross financing receivables $26,565 $25,508
Specific allowance for credit losses 305 416
Unallocated allowance for credit losses 96 120
Total allowance for credit losses 401 536
Net financing receivables $26,164 $24,972
Allowance for credit losses coverage 1.5% 2.1%
Roll Forward of Global Financing Receivables
Allowance for Credit Losses
($ in millions)
Allowance Additions/ Dec. 31,
Jan. 1, 2010 Used* (Reductions) Other** 2010
$536 $(121) $(9) $(4) $401
* Represents reserved receivables, net of recoveries, that were disposed of during
the period.
** Primarily represents translation adjustments.
The percentage of Global Financing receivables reserved decreased
from 2.1 percent at December 31, 2009 to 1.5 percent at December
31, 2010 primarily due to the disposition of receivables previously
reserved and the increase in gross financing receivables. Specific
reserves decreased 26.7 percent from $416 million at December 31,
2009 to $305 million at December 31, 2010. Unallocated reserves
decreased 20.2 percent from $120 million at December 31, 2009,
to $96 million at December 31, 2010. Global Financing’s bad debt
expense was a decrease of $9 million for 2010, compared to
an increase of $143 million for 2009. The year-to-year decrease
was primarily attributed to the decline of required specific reserve
additions and recoveries on previously reserved accounts.
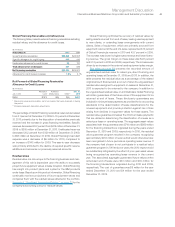
Residual Value
Residual value is a risk unique to the financing business and man-
agement of this risk is dependent upon the ability to accurately
project future equipment values at lease inception. Global Financing
has insight into product plans and cycles for the IBM products
under lease. Based upon this product information, Global Financing
continually monitors projections of future equipment values and
compares them with the residual values reflected in the portfolio.
See note A, “Significant Accounting Policies,” on page 78 for the
company’s accounting policy for residual values.
Global Financing optimizes the recovery of residual values by
selling assets sourced from end of lease, leasing used equipment
to new clients, or extending lease arrangements with current
clients. Sales of equipment, which are primarily sourced from
equipment returned at the end of a lease, represented 47.4 percent
of Global Financing’s revenue in 2010 and 43.7 percent in 2009.
The increase was driven by higher sales revenue and lower financ-
ing revenue. The gross margin on these sales was 52.8 percent
and 51.3 percent in 2010 and 2009, respectively. The increase was
driven by an increase in the external used equipment sales margin.
The table on page 58 presents the recorded amount of
unguaranteed residual value for sales-type, direct financing and
operating leases at December 31, 2009 and 2010. In addition, the
table presents the residual value as a percentage of the related
original amount financed and a run out of when the unguaranteed
residual value assigned to equipment on leases at December 31,
2010 is expected to be returned to the company. In addition to
the unguaranteed residual value, on a limited basis, Global Financing
will obtain guarantees of the future value of the equipment to be
returned at end of lease. These third-party guarantees are
included in minimum lease payments as provided for by accounting
standards in the determination of lease classifications for the
covered equipment and provide protection against risk of loss
arising from declines in equipment values for these assets. The
residual value guarantee increases the minimum lease payments
that are utilized in determining the classification of a lease as a
sales-type lease or operating lease. The aggregate asset values
associated with the guarantees were $714 million and $569 million
for the financing transactions originated during the years ended
December 31, 2010 and 2009, respectively. In 2010, the residual
value guarantee program resulted in the company recognizing
approximately $453 million of revenue that would otherwise have
been recognized in future periods as operating lease revenue. If
the company had chosen to not participate in a residual value
guarantee program in 2010 and prior years, the 2010 impact would
be substantially mitigated by the effect of prior-year asset values
being recognized as operating lease revenue in the current
year. The associated aggregate guaranteed future values at the
scheduled end of lease were $43 million and $30 million for
the financing transactions originated during 2010 and 2009,
respectively. The cost of guarantees was $5 million for the year
ended December 31, 2010 and $4 million for the year ended
December 31, 2009.