IBM 2010 Annual Report Download - page 93
Download and view the complete annual report
Please find page 93 of the 2010 IBM annual report below. You can navigate through the pages in the report by either clicking on the pages listed below, or by using the keyword search tool below to find specific information within the annual report.-
 1
1 -
2
-
3
-
4
-
5
-
6
-
7
-
8
-
9
-
10
-
11
-
12
-
13
-
14
-
15
-
16
-
17
-
18
-
19
-
20
-
21
-
22
-
23
-
24
-
25
-
26
-
27
-
28
-
29
-
30
-
31
-
32
-
33
-
34
-
35
-
36
-
37
-
38
-
39
-
40
-
41
-
42
-
43
-
44
-
45
-
46
-
47
-
48
-
49
-
50
-
51
-
52
-
53
-
54
-
55
-
56
-
57
-
58
-
59
-
60
-
61
-
62
-
63
-
64
-
65
-
66
-
67
-
68
-
69
-
70
-
71
-
72
-
73
-
74
-
75
-
76
-
77
-
78
-
79
-
80
-
81
-
82
-
 83
83 -
 84
84 -
 85
85 -
 86
86 -
 87
87 -
 88
88 -
 89
89 -
 90
90 -
 91
91 -
 92
92 -
 93
93 -
 94
94 -
 95
95 -
 96
96 -
 97
97 -
 98
98 -
 99
99 -
 100
100 -
 101
101 -
 102
102 -
 103
103 -
104
-
105
-
106
-
107
-
108
-
109
-
110
-
111
-
112
-
113
-
114
-
115
-
116
-
117
-
118
-
119
-
120
-
121
-
122
-
123
-
124
-
125
-
126
-
127
-
128
-
129
-
130
-
131
-
132
-
133
-
134
-
135
-
136
-
137
-
138
-
139
-
140
 |
 |

Notes to Consolidated Financial Statements
International Business Machines Corporation and Subsidiary Companies 91
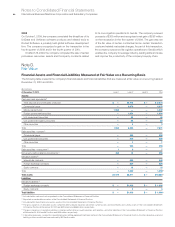
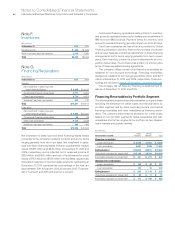
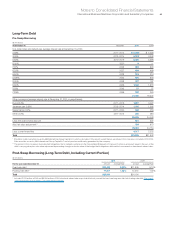
Financing Receivables on Non-Accrual Status
The following table presents the recorded investment in financing
receivables which are on non-accrual status.
($ in millions)
At December 31: 2010
Major markets $ 69
Growth markets 33
Total lease receivables $101
Major markets $141
Growth markets 123
Total loan receivables $264
Total receivables $366
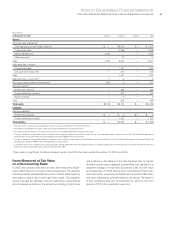
Impaired Loans
The following table presents impaired client loan receivables.
($ in millions)
Recorded Related
At December 31, 2010: Investment Allowance
Major markets $196 $119
Growth markets 132 68
Tot a l $328 $187
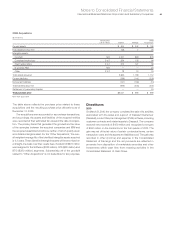
Credit Quality Indicators
The company’s credit quality indicators are based on rating agency
data, publicly available information and information provided by
the companies, and are reviewed periodically based on the relative
level of risk. The resulting indicators are a numerical rating system
that maps to Moody’s Investors Service credit ratings as shown
below. Moody’s has not provided to the company a credit rating
on its clients.
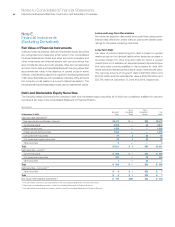
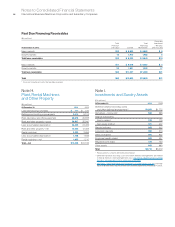
The following table presents the gross recorded investment
for each class of receivables, by credit quality indicator. Receivables
with a credit quality indicator ranging from Aaa to Baa3 are
considered investment grade. All others are considered non-
investment grade.
Lease Receivables
($ in millions)
Major Growth
At December 31, 2010: Markets Markets
Credit rating:
Aaa – Aa3 $ 787 $ 178
A1 – A3 1,444 178
Baa1 – Baa3 2,494 833
Ba1 – Ba2 853 397
Ba3 – B1 525 238
B2 – B3 262 99
Caa – D 197 59
Tot a l $6,562 $1,983
Loan Receivables
($ in millions)
Major Growth
At December 31, 2010: Markets Markets
Credit rating:
Aaa – Aa3 $1,090 $ 179
A1 – A3 1,999 179
Baa1 – Baa3 3,453 837
Ba1 – Ba2 1,181 399
Ba3 – B1 727 239
B2 – B3 363 100
Caa – D 273 60
Tot a l $9,087 $1,993
At December 31, 2010, the industries which make up Global
Financing’s receivables portfolio consist of: Financial (36 percent),
Government (16 percent), Manufacturing (14 percent), Retail
(9 percent), Services (8 percent), Communications (5 percent) and
Other (12 percent).