IBM 2010 Annual Report Download - page 12
Download and view the complete annual report
Please find page 12 of the 2010 IBM annual report below. You can navigate through the pages in the report by either clicking on the pages listed below, or by using the keyword search tool below to find specific information within the annual report.-
 1
1 -
 2
2 -
 3
3 -
 4
4 -
 5
5 -
 6
6 -
 7
7 -
 8
8 -
 9
9 -
 10
10 -
 11
11 -
 12
12 -
 13
13 -
 14
14 -
 15
15 -
 16
16 -
 17
17 -
 18
18 -
 19
19 -
 20
20 -
 21
21 -
 22
22 -
23
-
24
-
25
-
26
-
27
-
28
-
29
-
30
-
31
-
32
-
33
-
34
-
35
-
36
-
37
-
38
-
39
-
40
-
41
-
42
-
43
-
44
-
45
-
46
-
47
-
48
-
49
-
50
-
51
-
52
-
53
-
54
-
55
-
56
-
57
-
58
-
59
-
60
-
61
-
62
-
63
-
64
-
65
-
66
-
67
-
68
-
69
-
70
-
71
-
72
-
73
-
74
-
75
-
76
-
77
-
78
-
79
-
80
-
81
-
82
-
83
-
84
-
85
-
86
-
87
-
88
-
89
-
90
-
91
-
92
-
93
-
94
-
95
-
96
-
97
-
98
-
99
-
100
-
101
-
102
-
103
-
104
-
105
-
106
-
107
-
108
-
109
-
110
-
111
-
112
-
113
-
114
-
115
-
116
-
117
-
118
-
119
-
120
-
121
-
122
-
123
-
124
-
125
-
126
-
127
-
128
-
129
-
130
-
131
-
132
-
133
-
134
-
135
-
136
-
137
-
138
-
139
-
140
 |
 |
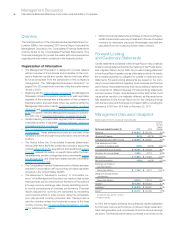
2000**
2010
8.1 9.12.0
11% 40% 25%
$201612840
1.6
8% 9% 39% 44%
1.2 4.5 2.8
24%
2.7
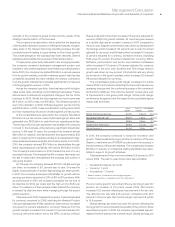
21
%
11%
00 06 07 08 09 10
50%
25 8
0
4
12
$16
0
00 10 00 10
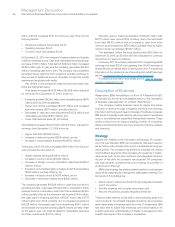
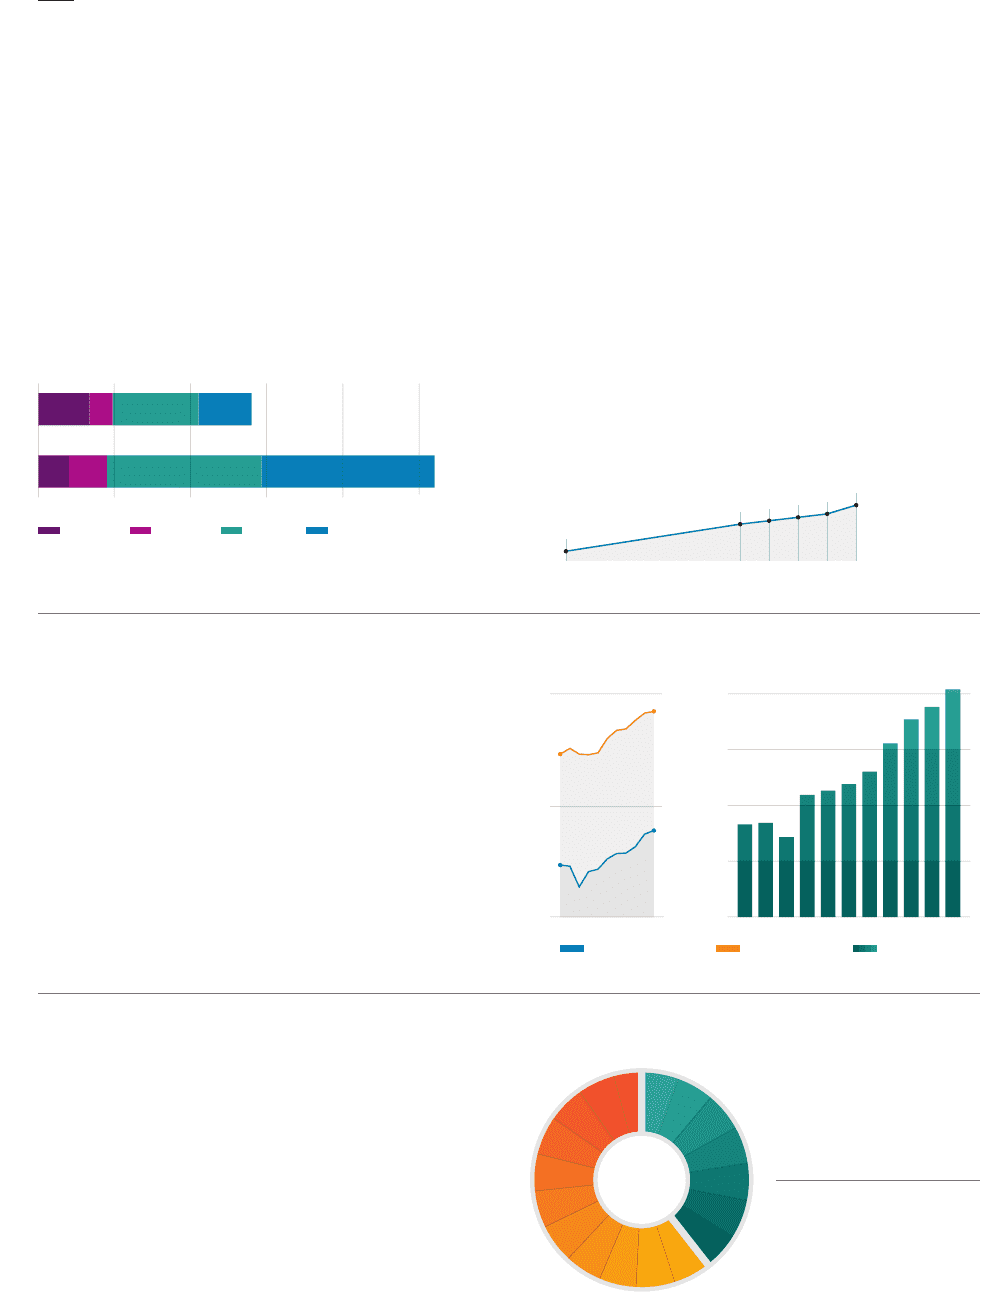
12%
19.7%
46.1%
37%
$70billion
Reinvested
Capital Expenditures & Acquisitions
$107billion
Returned to Shareholders
Share Repurchases & Dividends
$177
billion
Hardware Financing Services Software
Pre-Tax Income Margin Gross Profit Margin Free Cash Flow
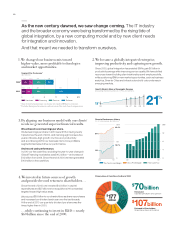
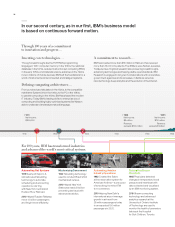
As the new century dawned, we saw change coming. The IT industry
and the broader economy were being transformed by the rising tide of
global integration, by a new computing model and by new client needs
for integration and innovation.
And that meant we needed to transform ourselves.
* Sum of external segment pre-tax income not equal to IBM pre-tax income.
** Excludes Enterprise Investments and not restated for stock-based compensation.
1. We changed our business mix toward
higher-value, more profitable technologies
and market opportunities.
2. We became a globally integrated enterprise,
improving productivity and capturing new growth.
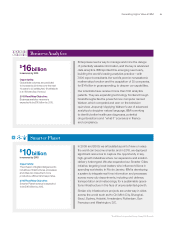
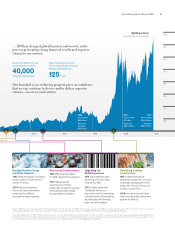
Since 2005, global integration has enabled IBM to gain $6 billion in
productivity savings while improving service quality. We have shifted
resources toward building client relationships and employee skills,
while positioning IBM for new market opportunities, such as business
analytics, Smarter Cities and infrastructure build-outs underway in
emerging markets.
4. We invested in future sources of growth
and provided record returns to shareholders …
Since the end of 2000, we invested $43 billion in capital
expenditures and $27 billion net on acquisitions (116 companies)
targeted toward high-value areas.
We returned $89 billion to our shareholders as share repurchases
and increased our dividend each year over the last decade.
At the end of 2010 our quarterly dividend per share was five
times higher than in 2000.
… while continuing to invest in R&D
—
nearly
$60 billion since the end of 2000.
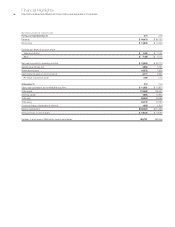
3. By aligning our business model with our clients’
needs we generated superior financial results.
We achieved record earnings per share.
Diluted earnings per share in 2010 were $11.52, having nearly
tripled since the end of 2000, and marking eight consecutive
years of double-digit growth. Our focus on productivity
and a continuing shift in our business mix to more profitable
segments has helped drive our performance.
And record cash performance.
In 2010 our free cash flow, excluding the year-to-year change in
Global Financing receivables, was $16.3 billion—an increase of
$1.2 billion from 2009. Since the end of 2000 we have generated
$109 billion in free cash flow.
Primary Uses of Cash Since the End of 2000
Growth Markets Share of Geographic Revenue
(excluding divested businesses of PCs and printers)
Segment Pre-Tax Income*
($ in billions)
Financial Performance History
(% of total revenue, $ in billions)
10