IBM 2010 Annual Report Download - page 94
Download and view the complete annual report
Please find page 94 of the 2010 IBM annual report below. You can navigate through the pages in the report by either clicking on the pages listed below, or by using the keyword search tool below to find specific information within the annual report.-
 1
1 -
2
-
3
-
4
-
5
-
6
-
7
-
8
-
9
-
10
-
11
-
12
-
13
-
14
-
15
-
16
-
17
-
18
-
19
-
20
-
21
-
22
-
23
-
24
-
25
-
26
-
27
-
28
-
29
-
30
-
31
-
32
-
33
-
34
-
35
-
36
-
37
-
38
-
39
-
40
-
41
-
42
-
43
-
44
-
45
-
46
-
47
-
48
-
49
-
50
-
51
-
52
-
53
-
54
-
55
-
56
-
57
-
58
-
59
-
60
-
61
-
62
-
63
-
64
-
65
-
66
-
67
-
68
-
69
-
70
-
71
-
72
-
73
-
74
-
75
-
76
-
77
-
78
-
79
-
80
-
81
-
82
-
83
-
 84
84 -
 85
85 -
 86
86 -
 87
87 -
 88
88 -
 89
89 -
 90
90 -
 91
91 -
 92
92 -
 93
93 -
 94
94 -
 95
95 -
 96
96 -
 97
97 -
 98
98 -
 99
99 -
 100
100 -
 101
101 -
 102
102 -
 103
103 -
 104
104 -
105
-
106
-
107
-
108
-
109
-
110
-
111
-
112
-
113
-
114
-
115
-
116
-
117
-
118
-
119
-
120
-
121
-
122
-
123
-
124
-
125
-
126
-
127
-
128
-
129
-
130
-
131
-
132
-
133
-
134
-
135
-
136
-
137
-
138
-
139
-
140
 |
 |

Notes to Consolidated Financial Statements
International Business Machines Corporation and Subsidiary Companies92
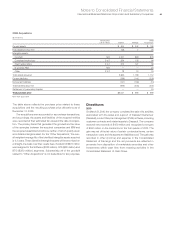
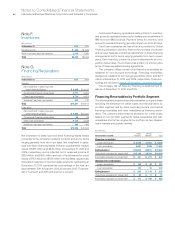
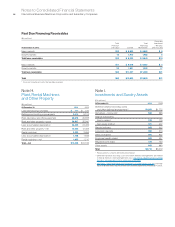
Past Due Financing Receivables
($ in millions)
Recorded
Total Total Investment
Past Due Financing > 90 Days
At December 31, 2010: > 90 days* Current Receivables and Accruing
Major markets $10 $ 6,552 $ 6,562 $ 5
Growth markets 13 1,970 1,983 5
Total lease receivables $22 $ 8,523 $ 8,545 $10
Major markets $11 $ 9,076 $ 9,087 $ 4
Growth markets 32 1,961 1,993 17
Total loan receivables $43 $11,037 $11,080 $21
Tot a l $65 $19,560 $19,625 $31
* Does not include accounts that are fully reserved.
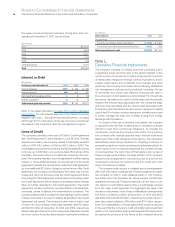
Note H.
Plant, Rental Machines
and Other Property
($ in millions)
At December 31: 2010 2009
Land and land improvements $ 777 $ 737
Buildings and building improvements 9,414 9,314
Plant, laboratory and office equipment 26,676 25,888
Plant and other property—gross 36,867 35,940
Less: accumulated depreciation 24,435 23,485
Plant and other property—net 12,432 12,455
Rental machines 3,422 3,656
Less: accumulated depreciation 1,758 1,946
Rental machines—net 1,665 1,710
Total— net $14,096 $14,165
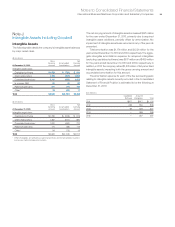
Note I.
Investments and Sundry Assets
($ in millions)
At December 31: 2010 2009*
Deferred transition and setup costs
and other deferred arrangements** $1,853 $1,772
Derivatives — noncurrent + 588 565
Alliance investments:
Equity method 122 115
Non-equity method 531 477
Prepaid software 268 312
Long-term deposits 350 310
Other receivables 560 617
Employee benefit-related 409 427
Prepaid income taxes 434 123
Other assets 663 660
Tot a l $5,778 $5,379
* Reclassified to conform with 2010 presentation.
** Deferred transition and setup costs and other deferred arrangements are related
to Global Services client arrangements. Also see note A, “Significant Accounting
Policies,” on pages 68 to 79 for additional information.
+ See note L, “Derivative Financial Instruments,” on pages 96 through 101 for the fair
value of all derivatives reported in the Consolidated Statement of Financial Position.