IBM 2010 Annual Report Download - page 39
Download and view the complete annual report
Please find page 39 of the 2010 IBM annual report below. You can navigate through the pages in the report by either clicking on the pages listed below, or by using the keyword search tool below to find specific information within the annual report.-
 1
1 -
2
-
3
-
4
-
5
-
6
-
7
-
8
-
9
-
10
-
11
-
12
-
13
-
14
-
15
-
16
-
17
-
18
-
19
-
20
-
21
-
22
-
23
-
24
-
25
-
26
-
27
-
28
-
 29
29 -
 30
30 -
 31
31 -
 32
32 -
 33
33 -
 34
34 -
 35
35 -
 36
36 -
 37
37 -
 38
38 -
 39
39 -
 40
40 -
 41
41 -
 42
42 -
 43
43 -
 44
44 -
 45
45 -
 46
46 -
 47
47 -
 48
48 -
 49
49 -
50
-
51
-
52
-
53
-
54
-
55
-
56
-
57
-
58
-
59
-
60
-
61
-
62
-
63
-
64
-
65
-
66
-
67
-
68
-
69
-
70
-
71
-
72
-
73
-
74
-
75
-
76
-
77
-
78
-
79
-
80
-
81
-
82
-
83
-
84
-
85
-
86
-
87
-
88
-
89
-
90
-
91
-
92
-
93
-
94
-
95
-
96
-
97
-
98
-
99
-
100
-
101
-
102
-
103
-
104
-
105
-
106
-
107
-
108
-
109
-
110
-
111
-
112
-
113
-
114
-
115
-
116
-
117
-
118
-
119
-
120
-
121
-
122
-
123
-
124
-
125
-
126
-
127
-
128
-
129
-
130
-
131
-
132
-
133
-
134
-
135
-
136
-
137
-
138
-
139
-
140
 |
 |

37
Management Discussion
International Business Machines Corporation and Subsidiary Companies
led by the BRIC countries which increased 18.7 percent (17 percent
adjusted for currency). Business analytics, another of the company’s
key growth initiatives, had revenue growth of 19 percent in the
fourth quarter.
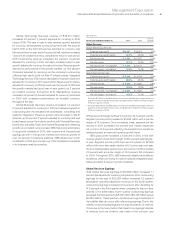
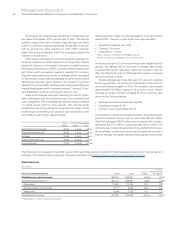
The consolidated gross profit margin increased 0.8 points
versus the fourth quarter of 2009 to 49.0 percent with improved
margins in Systems and Technology and Software. Gross profit
margin performance by segment and the impact to the consolidated
gross margin was as follows:
Gross Yr.-to-Yr. Consolidated
Margin Change Impact
Global Technology Services 34.7% (1.1) pts. (0.1) pts.
Global Business Services 28.3% (2.0) pts. (0.2) pts.
Software 88.5% 0.9 pts. 0.3 pts.
Systems and Technology 43.9% 1.4 pts. 0.2 pts.
Global Financing 51.8% (0.1) pts. (0.0) pts.
Total expense and other income increased 7.5 percent in the fourth
quarter compared to the prior year, in line with the revenue growth
in the quarter. The year-to-year drivers were approximately:
• Operational expense, 5 points
• Currency,* (2) points
• Acquisitions,** 4 points
* Reflects impacts of translation and hedging programs.
** Includes acquisitions completed in prior 12-month period.
Pre-tax income increased 9.0 percent and pre-tax margin improved
0.5 points to 24.0 percent versus the fourth quarter of 2009. Net
income increased 9.2 percent and the net income margin improved
0.4 points to 18.1 percent.
Diluted earnings per share improved 16.4 percent reflecting
the growth in net income and the benefits of the common stock
repurchase program. In the fourth quarter, the company repur-
chased 25.1 million shares of its common stock. Diluted earnings
per share of $4.18 increased $0.59 from the prior year driven by
the following factors:
• Revenue increase at actual rates, $0.24
• Operating leverage, $0.09
• Common stock repurchases, $0.26
Segments
The Global Services segments had combined revenue of $14,923
million in the fourth quarter, an increase of 2.0 percent (2 percent
adjusted for currency) and delivered pre-tax profit of $2,403 million,
an increase of 3.5 percent year to year. Total signings for Global
Services in the fourth quarter were $22,094 million, an increase
of 17.8 percent (18 percent adjusted for currency) versus 2009.
Outsourcing signings of $14,138 million increased 24.2 percent (23
percent adjusted for currency). Transactional signings increased
7.8 percent (9 percent adjusted for currency) to $7,956 million
with growth in both GBS and GTS. Signings in the quarter included
19 deals greater than $100 million.
GTS revenue of $10,165 million increased 1.1 percent (1 percent
adjusted for currency) versus the fourth quarter of 2009. Out-
sourcing revenue increased 1.3 percent (1 percent adjusted
for currency). The estimated outsourcing backlog, which is the
primary driver of outsourcing revenue, was $97 billion at December
31, 2010, an increase of $3 billion ($1 billion adjusted for currency)
compared to the December 31, 2009 level and an increase of $6
billion ($5 billion adjusted for currency) from September 30, 2010.
Fourth-quarter revenue was driven primarily from existing backlog
while revenue from base accounts also increased for the first time
since the fourth quarter of 2008. The increase in the outsourcing
backlog was due to significant demand for the company’s offerings
in the growth markets as clients build out their infrastructures. ITS
revenue decreased 0.6 percent (flat adjusted for currency) versus
the prior year. Revenue performance in the fourth quarter improved
from previous quarters with the growth markets continuing to have
good performance.
GTS gross profit margin of 34.7 percent declined 1.1 points
compared to the fourth quarter of 2009. The GTS segment pre-tax
profit of $1,657 million was up 6.5 percent and the margin expanded
0.9 points to 15.8 percent from the fourth quarter of 2009.
GBS revenue of $4,758 million increased 3.9 percent (4 percent
adjusted for currency) compared to the fourth quarter of 2009
with growth both in outsourcing and the transactional businesses:
consulting and systems integration. In the quarter, GBS gained
share overall with gains in Consulting and sustained share in
Application Management Services. From a geographic perspective,
revenue performance was led by North America with growth of 11
percent, adjusted for currency. From an industry sector perspective,
revenue growth was led by Distribution, Financial Services, Industrial
and General Business. The growth initiatives continued to have
good performance with GBS business analytics revenue up over
40 percent in the fourth quarter.
GBS gross profit margin of 28.3 percent declined 2.0 points
year to year. The GBS segment pre-tax profit of $746 million
declined 2.7 percent in the fourth quarter and pre-tax margin
declined 0.9 points to 15.0 percent. GBS has improved utilization
and delivery excellence, while continuing to invest in globally
integrated capabilities and skills to support growth initiatives.
Software revenue of $7,039 million increased 7.0 percent (8
percent adjusted for currency). Adjusting for the divested PLM
operations, revenue grew at 12 percent adjusted for currency
in the fourth quarter. Revenue from Key Branded Middleware
increased 13.4 percent (15 percent adjusted for currency) and
gained share for the 13th straight quarter as the software business
continued to extend its lead in the middleware market. Software
revenue continues to mix to the faster growing branded middleware
and, in the fourth quarter, it accounted for 66 percent of total
software revenue, an increase of 3 points year to year. Revenue
performance in the fourth quarter of 2010 was led by WebSphere
which increased 32.2 percent (34 percent adjusted for currency),
Tivoli up 12.1 percent (14 percent adjusted for currency), Rational
up 10.2 percent (12 percent adjusted for currency) and Information
Management up 10.4 percent (12 percent adjusted for currency).
The company continues to add to its software capabilities. With