IBM 2010 Annual Report Download - page 28
Download and view the complete annual report
Please find page 28 of the 2010 IBM annual report below. You can navigate through the pages in the report by either clicking on the pages listed below, or by using the keyword search tool below to find specific information within the annual report.-
 1
1 -
2
-
3
-
4
-
5
-
6
-
7
-
8
-
9
-
10
-
11
-
12
-
13
-
14
-
15
-
16
-
17
-
 18
18 -
 19
19 -
 20
20 -
 21
21 -
 22
22 -
 23
23 -
 24
24 -
 25
25 -
 26
26 -
 27
27 -
 28
28 -
 29
29 -
 30
30 -
 31
31 -
 32
32 -
 33
33 -
 34
34 -
 35
35 -
 36
36 -
 37
37 -
 38
38 -
39
-
40
-
41
-
42
-
43
-
44
-
45
-
46
-
47
-
48
-
49
-
50
-
51
-
52
-
53
-
54
-
55
-
56
-
57
-
58
-
59
-
60
-
61
-
62
-
63
-
64
-
65
-
66
-
67
-
68
-
69
-
70
-
71
-
72
-
73
-
74
-
75
-
76
-
77
-
78
-
79
-
80
-
81
-
82
-
83
-
84
-
85
-
86
-
87
-
88
-
89
-
90
-
91
-
92
-
93
-
94
-
95
-
96
-
97
-
98
-
99
-
100
-
101
-
102
-
103
-
104
-
105
-
106
-
107
-
108
-
109
-
110
-
111
-
112
-
113
-
114
-
115
-
116
-
117
-
118
-
119
-
120
-
121
-
122
-
123
-
124
-
125
-
126
-
127
-
128
-
129
-
130
-
131
-
132
-
133
-
134
-
135
-
136
-
137
-
138
-
139
-
140
 |
 |

26
Management Discussion
International Business Machines Corporation and Subsidiary Companies
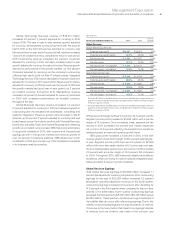
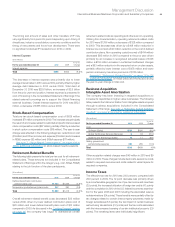
Workforce rebalancing charges were recorded in the first quarter
of 2009 and 2010. The PLM and Geodis divestiture transactions
were recorded in the first quarter of 2010 and the first quarter of
2009, respectively. These transactions impacted the year-to-
year segment results for 2010 compared to 2009. Workforce
rebalancing charges were incurred in every segment while the
PLM transaction gain was recorded in Software and the Geodis
transaction gain was recorded in the following segments: Global
Technology Services ($81 million), Global Business Services
($46 million), Software ($106 million) and Systems and Technology
($64 million). In the following segment analysis and in the Global
Financing analysis on page 55, each segment’s pre-tax income
and pre-tax margin for 2010 is presented on an as reported basis
and on a basis normalized for these transactions in both years
to provide a better perspective of the underlying operational
performance of the segments.
The segment results reflect the company’s continuing shift to
higher value areas, while divesting commoditizing businesses. Total
Global Services pre-tax income has increased to over $8 billion
in 2010 compared to $4.5 billion in 2000. Software pre-tax income
of $9 billion in 2010 has more than tripled since 2000 and now
contributes 44 percent of total segment profit compared to 25
percent in 2000.
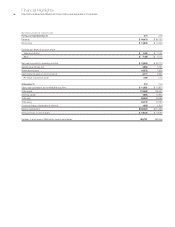
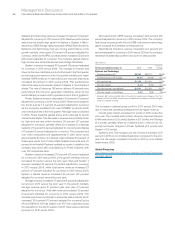
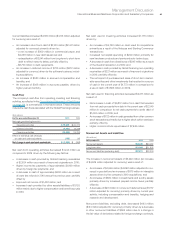
($ in millions)
Yr.- to -Yr.
Yr.-to-Yr. Change Adjusted
For the year ended December 31: 2010 2009 Change for Currency
Global Services external revenue: $56,424 $55,000 2.6% 1.0%
Global Technology Services $38,201 $37,347 2.3% 0.7%
Outsourcing 22,241 21,620 2.9 1.1
Integrated Technology Services 8,714 8,771 (0.6) (1.8)
Maintenance 7,250 6,956 4.2 2.6
Global Business Services $18,223 $17,653 3.2% 1.6%
Global Services
The Global Services segments, GTS and GBS, delivered combined
revenue of $56,424 million, an increase of 2.6 percent (1 percent
adjusted for currency) in 2010 when compared to 2009. Services
revenue performance at constant currency improved over the
course of 2010 led by the transaction businesses. In the first and
second quarter, revenue, adjusted for currency, decreased 2 percent
and increased 1 percent, respectively, versus the prior year periods.
In the third and fourth quarters, revenue increased 2 percent, at
constant currency, in each period. The estimated Global Services
backlog at actual currency rates was $142 billion at December 31,
2010, an increase of $5 billion ($4 billion adjusted for currency)
compared to the December 31, 2009 level. Backlog for the out-
sourcing businesses at actual currency rates was estimated to
be $97 billion at December 31, 2010, an increase of $3 billion
($1 billion adjusted for currency) from December 31, 2009. The
Global Services segments delivered a combined pre-tax profit of
$8,136 million in 2010, a growth of 0.5 percent versus 2009 with
a pre-tax margin of 13.9 percent, down 0.2 points year to year.
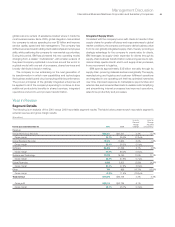
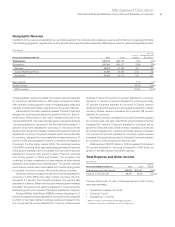
The following table presents each reportable segment’s external revenue as a percentage of total segment external revenue and each
reportable segment’s pre-tax income as a percentage of total segment pre-tax income.
Revenue Pre-tax Income*
For the year ended December 31: 2010 2009 2010 2009
Global Technology Services 38.5% 39.4% 26.8% 28.6%
Global Business Services 18.4 18.6 12.4 13.2
Total Global Services 56.9 58.0 39.2 41.9
Software 22.7 22.5 43.8 41.9
Systems and Technology 18.1 17.1 7.6 7.3
Global Financing 2.3 2.4 9.4 8.9
To t a l 100.0% 100.0% 100.0% 100.0%
* Segment pre-tax income includes transactions between segments that are intended to reflect an arm’s-length transfer price and excludes certain unallocated corporate items;
see note V, “Segment Information” for additional information.