IBM 2010 Annual Report Download - page 45
Download and view the complete annual report
Please find page 45 of the 2010 IBM annual report below. You can navigate through the pages in the report by either clicking on the pages listed below, or by using the keyword search tool below to find specific information within the annual report.-
 1
1 -
2
-
3
-
4
-
5
-
6
-
7
-
8
-
9
-
10
-
11
-
12
-
13
-
14
-
15
-
16
-
17
-
18
-
19
-
20
-
21
-
22
-
23
-
24
-
25
-
26
-
27
-
28
-
29
-
30
-
31
-
32
-
33
-
34
-
 35
35 -
 36
36 -
 37
37 -
 38
38 -
 39
39 -
 40
40 -
 41
41 -
 42
42 -
 43
43 -
 44
44 -
 45
45 -
 46
46 -
 47
47 -
 48
48 -
 49
49 -
 50
50 -
 51
51 -
 52
52 -
 53
53 -
 54
54 -
 55
55 -
56
-
57
-
58
-
59
-
60
-
61
-
62
-
63
-
64
-
65
-
66
-
67
-
68
-
69
-
70
-
71
-
72
-
73
-
74
-
75
-
76
-
77
-
78
-
79
-
80
-
81
-
82
-
83
-
84
-
85
-
86
-
87
-
88
-
89
-
90
-
91
-
92
-
93
-
94
-
95
-
96
-
97
-
98
-
99
-
100
-
101
-
102
-
103
-
104
-
105
-
106
-
107
-
108
-
109
-
110
-
111
-
112
-
113
-
114
-
115
-
116
-
117
-
118
-
119
-
120
-
121
-
122
-
123
-
124
-
125
-
126
-
127
-
128
-
129
-
130
-
131
-
132
-
133
-
134
-
135
-
136
-
137
-
138
-
139
-
140
 |
 |

43
Management Discussion
International Business Machines Corporation and Subsidiary Companies
($ in millions)
Yr.-to-Yr.
For the year ended December 31: 2009 2008 Change
Software:
External gross profit $18,405 $18,859 (2.4)%
External gross profit margin 86.0% 85.4% 0.6 pts.
Pre-tax income $ 8,095 $ 7,075 14.4%
Pre-tax margin 33.6% 28.5% 5.2 pts.
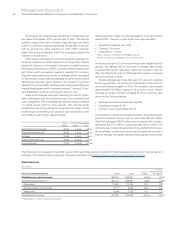
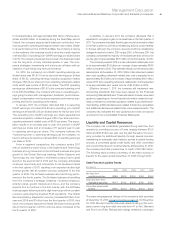
Systems and Technology revenue decreased 16.1 percent (15
percent adjusted for currency) in 2009 versus 2008 reflecting the
challenges that transactional-based businesses faced in the
difficult economic environment. While revenue performance
declined in 2009, the rate of decline improved sequentially in the
third and fourth quarters. The company gained share in Power
Systems, System x, blades and Storage external disk and tape
storage during 2009.
System z revenue decreased 28.7 percent (28 percent adjusted
for currency) in 2009 versus 2008. MIPS (millions of instructions
per second) shipments decreased 13 percent in 2009 versus
the prior year. MIPS increased 4 percent in 2009 on a two year
compounded growth rate and this performance was consistent
with what the company expected at this point in the product cycle.
In the third quarter, the company introduced System z Solution
Editions, which expanded the platform’s value proposition to both
new and existing clients.
Power Systems revenue decreased 10.7 percent (9 percent
adjusted for currency) in 2009 versus 2008. Low-end server
revenue declined 43 percent, mid-range server revenue decreased
2 percent and high-end server revenue decreased 10 percent
versus 2008. Although revenue declined, the company continued
to gain market share in the mid range and high end by helping
clients increase efficiency in their data centers by leveraging con-
solidation and virtualization results. This has led to seven con-
secutive quarters of share gains. In addition, in 2009, the company
increased sales generated by UNIX competitive displacements to
over $600 million.
Software gross profit of $18,405 million in 2009 decreased 2.4
percent versus 2008, driven primarily by declining revenue. Gross
profit margin expanded 0.6 points to 86.0 percent in 2009. The
Software segment delivered $8,095 million of pre-tax profit in
2009, an increase of 14.4 percent versus 2008. The segment pre-
tax profit margin expanded 5.2 points to 33.6 percent. The breadth
of the software portfolio, the strong recurring revenue stream and
the actions taken to improve efficiency and productivity combined
to deliver strong profit results.
System x revenue decreased 4.6 percent (3 percent adjusted
for currency) in 2009 versus 2008. Revenue performance in the
second half of the year was strong with third-quarter revenue
increasing 0.6 percent (2 percent adjusted for currency) and fourth-
quarter revenue increasing 36.8 percent (30 percent adjusted for
currency) compared to the prior-year periods. System x server
revenue declined 4 percent, primarily driven by decreased low-end
server revenue (10 percent) in 2009 versus 2008. Blades revenue
increased 11 percent in 2009 versus 2008. System x server gained
share in four consecutive quarters. The company’s improved sales
model and enhanced product offerings were the key contributors
to this performance.
Storage revenue decreased 12.0 percent (11 percent adjusted
for currency) in 2009 versus 2008. Total disk revenue decreased
9 percent versus 2008. These decreases were driven by declines
in mid-range disk revenue of 18 percent and decreased Enterprise
Disk revenue of 6 percent. In the fourth quarter, the company intro-
duced the DS8700 product, the latest addition to the DS8000 line
of high-end disk systems. The company’s storage acquisitions, XIV
and Diligent, had strong performance. XIV has added over 400 new
customers since the acquisition. Tape revenue declined 20 percent
in 2009 versus 2008.
Retail Stores Solutions revenue decreased 25.6 percent (24
percent adjusted for currency) in 2009 versus 2008, reflecting
continued weakness in the retail sector.
Microelectronics OEM revenue decreased 15.1 percent (15
percent adjusted for currency), in 2009 versus 2008. Although
2009 revenue declined, second-half revenue improved significantly
over first-half performance with performance essentially flat
compared to the prior year.
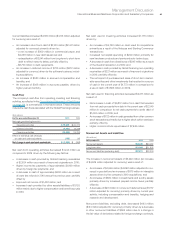
Systems and Technology
($ in millions)
Yr.-to-Yr.
Yr.-to-Yr. Change Adjusted
For the year ended December 31: 2009 2008 Change for Currency
Systems and Technology external revenue: $16,190 $19,287 (16.1)% (14.9)%
System z (28.7)% (27.5)%
Power Systems (10.7) (9.2)
System x (4.6) (3.3)
Storage (12.0) (11.0)
Retail Store Solutions (25.6) (23.6)
Total Systems (15.9) (14.6)
Microelectronics OEM (15.1) (15.2)