IBM 2010 Annual Report Download - page 64
Download and view the complete annual report
Please find page 64 of the 2010 IBM annual report below. You can navigate through the pages in the report by either clicking on the pages listed below, or by using the keyword search tool below to find specific information within the annual report.-
 1
1 -
2
-
3
-
4
-
5
-
6
-
7
-
8
-
9
-
10
-
11
-
12
-
13
-
14
-
15
-
16
-
17
-
18
-
19
-
20
-
21
-
22
-
23
-
24
-
25
-
26
-
27
-
28
-
29
-
30
-
31
-
32
-
33
-
34
-
35
-
36
-
37
-
38
-
39
-
40
-
41
-
42
-
43
-
44
-
45
-
46
-
47
-
48
-
49
-
50
-
51
-
52
-
53
-
 54
54 -
 55
55 -
 56
56 -
 57
57 -
 58
58 -
 59
59 -
 60
60 -
 61
61 -
 62
62 -
 63
63 -
 64
64 -
 65
65 -
 66
66 -
 67
67 -
 68
68 -
 69
69 -
 70
70 -
 71
71 -
 72
72 -
 73
73 -
 74
74 -
75
-
76
-
77
-
78
-
79
-
80
-
81
-
82
-
83
-
84
-
85
-
86
-
87
-
88
-
89
-
90
-
91
-
92
-
93
-
94
-
95
-
96
-
97
-
98
-
99
-
100
-
101
-
102
-
103
-
104
-
105
-
106
-
107
-
108
-
109
-
110
-
111
-
112
-
113
-
114
-
115
-
116
-
117
-
118
-
119
-
120
-
121
-
122
-
123
-
124
-
125
-
126
-
127
-
128
-
129
-
130
-
131
-
132
-
133
-
134
-
135
-
136
-
137
-
138
-
139
-
140
 |
 |

62
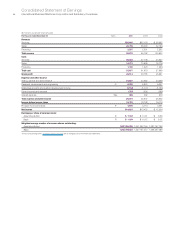
Consolidated Statement of Earnings
International Business Machines Corporation and Subsidiary Companies
($ in millions except per share amounts)
For the year ended December 31: Notes 2010 2009 2008
Revenue:
Services $56,868 $55,128 $ 58,892
Sales 40,736 38,300 42,156
Financing 2,267 2,331 2,582
Total revenue 99,870 95,758 103,630
Cost:
Services 38,383 37,146 40,937
Sales 14,374 13,606 15,776
Financing 1,100 1,220 1,256
Total cost 53,857 51,973 57,969
Gross profit 46,014 43,785 45,661
Expense and other income:
Selling, general and administrative 21,837 20,952 23,386
Research, development and engineering Q 6,026 5,820 6,337
Intellectual property and custom development income (1,154) (1,177) (1,153)
Other (income) and expense (787) (351) (298)
Interest expense K&L 368 402 673
Total expense and other income 26,291 25,647 28,945
Income before income taxes 19,723 18,138 16,715
Provision for income taxes P 4,890 4,713 4,381
Net income $14,833 $13,425 $ 12,334
Earnings per share of common stock:
Assuming dilution R $ 11.52 $ 10.01 $ 8.89
Basic R $ 11.69 $ 10.12 $ 9.02
Weighted-average number of common shares outstanding:
Assuming dilution 1,287,355,388 1,341,352,754 1,387,797,198
Basic 1,268,789,202 1,327,157,410 1,369,367,069
The accompanying notes on pages 68 through 130 are an integral part of the financial statements.