IBM 2010 Annual Report Download - page 119
Download and view the complete annual report
Please find page 119 of the 2010 IBM annual report below. You can navigate through the pages in the report by either clicking on the pages listed below, or by using the keyword search tool below to find specific information within the annual report.-
 1
1 -
2
-
3
-
4
-
5
-
6
-
7
-
8
-
9
-
10
-
11
-
12
-
13
-
14
-
15
-
16
-
17
-
18
-
19
-
20
-
21
-
22
-
23
-
24
-
25
-
26
-
27
-
28
-
29
-
30
-
31
-
32
-
33
-
34
-
35
-
36
-
37
-
38
-
39
-
40
-
41
-
42
-
43
-
44
-
45
-
46
-
47
-
48
-
49
-
50
-
51
-
52
-
53
-
54
-
55
-
56
-
57
-
58
-
59
-
60
-
61
-
62
-
63
-
64
-
65
-
66
-
67
-
68
-
69
-
70
-
71
-
72
-
73
-
74
-
75
-
76
-
77
-
78
-
79
-
80
-
81
-
82
-
83
-
84
-
85
-
86
-
87
-
88
-
89
-
90
-
91
-
92
-
93
-
94
-
95
-
96
-
97
-
98
-
99
-
100
-
101
-
102
-
103
-
104
-
105
-
106
-
107
-
108
-
 109
109 -
 110
110 -
 111
111 -
 112
112 -
 113
113 -
 114
114 -
 115
115 -
 116
116 -
 117
117 -
 118
118 -
 119
119 -
 120
120 -
 121
121 -
 122
122 -
 123
123 -
 124
124 -
 125
125 -
 126
126 -
 127
127 -
 128
128 -
 129
129 -
130
-
131
-
132
-
133
-
134
-
135
-
136
-
137
-
138
-
139
-
140
 |
 |

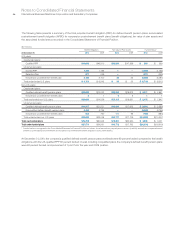
Notes to Consolidated Financial Statements
International Business Machines Corporation and Subsidiary Companies 117
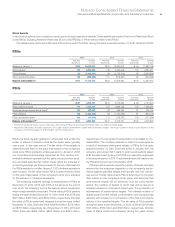
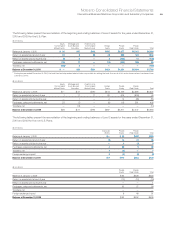
($ in millions)
Defined Benefit Pension Plans Nonpension Postretirement Benefit Plans
U.S. Plans Non-U.S. Plans U.S. Plan Non-U.S. Plans
For the year ended December 31: 2010 2009 2010 2009 2010 2009 2010 2009
Net loss at January 1 $14,880 $15,623 $17,172 $18,898 $397 $454 $167 $155
Current period loss/(gain) 1,456 (332) 1,130 (1,107) 96 (57) 24 24
Curtailments and settlements — — (10) 6 — — — —
Amortization of net loss included in net
periodic (income)/cost (471) (411) (712) (624) — — (12) (11)
Net loss at December 31 $15,865 $14,880 $17,580 $17,172 $492 $397 $180 $167
Prior service costs/(credits) at January 1 $ 159 $ 168 $ (1,104) $ (980) $ (14) $ (53) $ (19) $ (21)
Current period prior service costs/(credits) — — (28) (370) — — (0) (5)
Curtailments and settlements — — — 120 — — — —
Amortization of prior service (costs)/credits
included in net periodic (income)/cost (10) (10) 174 126 14 39 5 6
Prior service costs/(credits) at December 31 $ 149 $ 159 $ (958) $ (1,104) $ — $ (14) $ (14) $ (19)
Transition (assets)/liabilities at January 1 $ — $ — $ (1) $ (1) $ — $ — $ 1 $ 1
Amortization of transition assets/(liabilities)
included in net periodic (income)/cost — — 0 0 — — (0) 0
Transition (assets)/liabilities at December 31 $ — $ — $ (0) $ (1) $ — $ — $ 1 $ 1
Total loss recognized in accumulated
other comprehensive income/(loss)* $16,014 $15,038 $16,621 $16,067 $492 $ 382 $167 $148
* See note N, “Equity Activity,” on page 103 for the total change in the accumulated other comprehensive income/(loss) and the Consolidated Statement of Changes in Equity for
the components of net periodic (income)/cost, including the related tax effects, recognized in other comprehensive income/(loss) for the retirement-related benefit plans.
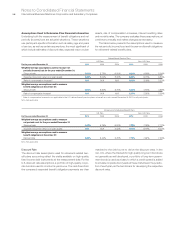
The following table presents the pre-tax estimated net loss, estimated prior service costs/(credits) and estimated transition (assets)/
liabilities of the retirement-related benefit plans that will be amortized from accumulated other comprehensive income/(loss) into net
periodic (income)/cost and recorded in the Consolidated Statement of Earnings in 2011.
($ in millions)
Defined Nonpension Post-
Benefit Pension Plans retirement Benefit Plans
U.S. Plans Non-U.S. Plans U.S. Plan Non-U.S. Plans
Net loss $844 $ 972 $— $13
Prior service costs/(credits) 9 (171) — (4)
Transition (assets)/liabilities — (0) — —
During the year ended December 31, 2010, the company paid
$22 million for mandatory pension insolvency insurance coverage
premiums in certain non-U.S. countries (Germany, Canada,
Luxembourg and the U.K.), a decrease of $118 million from the
year ended December 31, 2009, driven by a decline in insolvency
claims. Premiums were significantly higher during 2009 due to the
increased level of insolvencies experienced by other companies
as a result of the economic crisis.
No significant amendments of retirement-related benefit plans
occurred during the year ended December 31, 2010 that had a
material effect in the Consolidated Statement of Earnings.
During the year ended December 31, 2009, the company
approved changes to the United Kingdom Pension Plan which
included ending benefit accruals under this plan effective April 2011.
As a result of this action, the company recorded a curtailment gain
of $124 million included in 2009 net periodic (income)/cost and
reduced the PBO by $85 million. The company also amended its
cash balance and defined contribution plans in Japan to reduce
overall benefits for active participants for future years of service.
This amendment resulted in a decrease in the PBO of $359 million
and had no impact on 2009 net periodic (income)/cost.
During the year ended December 31, 2008, the IBM Board of
Directors approved a pension adjustment for certain U.S. retirees and
beneficiaries in the PPP. This adjustment provided a pension increase
to approximately 42,000 IBM retirees who retired before January 1,
1997. This adjustment resulted in an increase in the PBO of $222
million and had no impact on 2008 net periodic (income)/cost.
During the year ended December 31, 2008, the company
terminated one of its defined benefit pension plans in Japan that
resulted in a settlement gain of $140 million which was recorded
as part of 2008 net periodic (income)/cost and, also resulted in a
decrease in the PBO of $157 million.