IBM 2010 Annual Report Download - page 33
Download and view the complete annual report
Please find page 33 of the 2010 IBM annual report below. You can navigate through the pages in the report by either clicking on the pages listed below, or by using the keyword search tool below to find specific information within the annual report.-
 1
1 -
2
-
3
-
4
-
5
-
6
-
7
-
8
-
9
-
10
-
11
-
12
-
13
-
14
-
15
-
16
-
17
-
18
-
19
-
20
-
21
-
22
-
 23
23 -
 24
24 -
 25
25 -
 26
26 -
 27
27 -
 28
28 -
 29
29 -
 30
30 -
 31
31 -
 32
32 -
 33
33 -
 34
34 -
 35
35 -
 36
36 -
 37
37 -
 38
38 -
 39
39 -
 40
40 -
 41
41 -
 42
42 -
 43
43 -
44
-
45
-
46
-
47
-
48
-
49
-
50
-
51
-
52
-
53
-
54
-
55
-
56
-
57
-
58
-
59
-
60
-
61
-
62
-
63
-
64
-
65
-
66
-
67
-
68
-
69
-
70
-
71
-
72
-
73
-
74
-
75
-
76
-
77
-
78
-
79
-
80
-
81
-
82
-
83
-
84
-
85
-
86
-
87
-
88
-
89
-
90
-
91
-
92
-
93
-
94
-
95
-
96
-
97
-
98
-
99
-
100
-
101
-
102
-
103
-
104
-
105
-
106
-
107
-
108
-
109
-
110
-
111
-
112
-
113
-
114
-
115
-
116
-
117
-
118
-
119
-
120
-
121
-
122
-
123
-
124
-
125
-
126
-
127
-
128
-
129
-
130
-
131
-
132
-
133
-
134
-
135
-
136
-
137
-
138
-
139
-
140
 |
 |

31
Management Discussion
International Business Machines Corporation and Subsidiary Companies
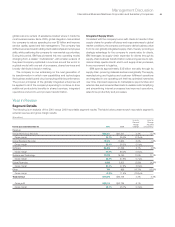
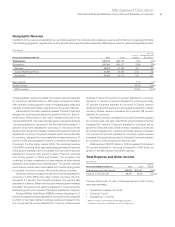
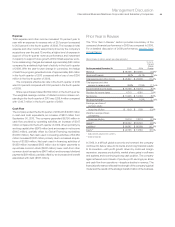
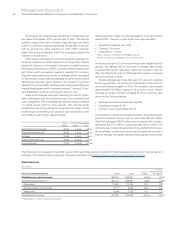
Geographic Revenue
In addition to the revenue presentation by reportable segment, the company also measures revenue performance on a geographic basis.
The following geographic, regional and country-specific revenue performance excludes OEM revenue, which is discussed separately below.
($ in millions)
Yr.-to-Yr.
Yr.-to-Yr. Change Adjusted
For the year ended December 31: 2010 2009 Change for Currency
Total revenue: $99,870 $95,758 4.3% 3.3%
Geographies: $97,060 $93,477 3.8% 2.8%
Americas 42,044 40,184 4.6 3.5
Europe/Middle East/Africa 31,866 32,583 (2.2) 0.8
Asia Pacific 23,150 20,710 11.8 4.7
Major markets 1.1% 1.0%
Growth markets 16.0% 10.9%
BRIC countries 22.8% 18.4%
Total geographic revenue increased 3.8 percent (3 percent adjusted
for currency) to $97,060 million in 2010 when compared to 2009,
with constant currency growth in each of the geographic areas and
markets. Overall performance was driven by the growth markets.
Revenue from the major markets increased 1.1 percent (1 percent
adjusted for currency) and was led by growth in the U.S., the U.K.
and France. Performance in the major markets improved in the
second half of 2010. The major markets grew 0.3 percent (declined
1 percent adjusted for currency) in the first half and increased 1.7
percent (3 percent adjusted for currency) in the second half.
Revenue from the growth markets increased 16.0 percent (11 percent
adjusted for currency). The growth markets performance, adjusted
for currency, outpaced the more established major markets by 10
points in 2010 and geographic revenue contribution increased to
21 percent, 2 points higher versus 2009. The combined revenue
in the BRIC countries, which represented approximately 40 percent
of the growth markets in 2010, increased 22.8 percent (18 percent
adjusted for currency) with growth in each of the four countries
and strong growth in China and Russia. The company has
continued to make investments in these markets to drive market
expansion and infrastructure development. The growth markets
performance overall was broad based with double-digit growth
at constant currency in a total of 40 growth market countries.
Americas revenue increased 4.6 percent (3 percent adjusted for
currency) in 2010. Within the major market countries, the U.S.
increased 2.7 percent and Canada increased 10.4 percent (flat
adjusted for currency). Revenue in the Latin America growth markets
increased 15.4 percent (14 percent adjusted for currency) led by
Brazil with growth of 20.4 percent (12 percent adjusted for currency).
Europe/Middle East/Africa (EMEA) revenue decreased 2.2
percent (increased 1 percent adjusted for currency) in 2010 compared
to 2009. In the major market countries, revenue increased in the
U.K. 4.5 percent (6 percent adjusted for currency), while revenue
declined in Spain 5.6 percent (1 percent adjusted for currency),
Germany 7.7 percent (3 percent adjusted for currency) and Italy
8.7 percent (4 percent adjusted for currency). In France, revenue
declined 1.8 percent as reported, but increased 4 percent at constant
currency. Russia revenue increased 49.0 percent (48 percent
adjusted for currency).
Asia Pacific revenue increased 11.8 percent (5 percent adjusted
for currency) year over year. Asia Pacific growth market countries
increased 18.3 percent (11 percent adjusted for currency), led by
growth in China and India. China revenue increased 23.4 percent
(23 percent adjusted for currency) and India revenue increased
19.2 percent (13 percent adjusted for currency). Japan revenue
increased 5.0 percent as reported but declined 2 percent adjusted
for currency in 2010 compared to the prior year.
OEM revenue of $2,811 million in 2010 increased 23.3 percent
(23 percent adjusted for currency) compared to 2009 driven by
growth in the Microelectronics OEM business.
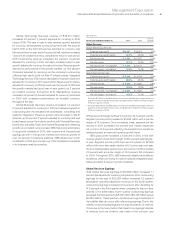
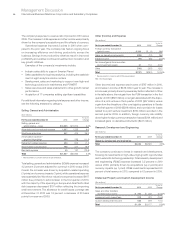
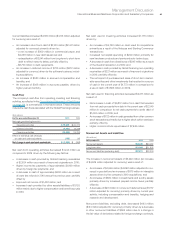
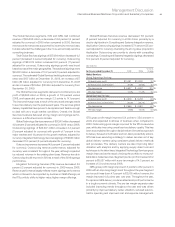
Total Expense and Other Income
($ in millions)
Yr.- to -Yr.
For the year ended December 31: 2010 2009 Change
Total expense and other income $26,291 $25,647 2.5%
Expense-to-revenue ratio 26.3% 26.8% (0.5) pts.
The key drivers year to year in total expense and other income
were approximately:
• Operational expense, (2) points
• Currency,* 1 point
• Acquisitions,** 3 points
* Reflects impacts of translation and hedging programs.
** Includes acquisitions completed in prior 12-month period.