IBM 2010 Annual Report Download - page 47
Download and view the complete annual report
Please find page 47 of the 2010 IBM annual report below. You can navigate through the pages in the report by either clicking on the pages listed below, or by using the keyword search tool below to find specific information within the annual report.-
 1
1 -
2
-
3
-
4
-
5
-
6
-
7
-
8
-
9
-
10
-
11
-
12
-
13
-
14
-
15
-
16
-
17
-
18
-
19
-
20
-
21
-
22
-
23
-
24
-
25
-
26
-
27
-
28
-
29
-
30
-
31
-
32
-
33
-
34
-
35
-
36
-
 37
37 -
 38
38 -
 39
39 -
 40
40 -
 41
41 -
 42
42 -
 43
43 -
 44
44 -
 45
45 -
 46
46 -
 47
47 -
 48
48 -
 49
49 -
 50
50 -
 51
51 -
 52
52 -
 53
53 -
 54
54 -
 55
55 -
 56
56 -
 57
57 -
58
-
59
-
60
-
61
-
62
-
63
-
64
-
65
-
66
-
67
-
68
-
69
-
70
-
71
-
72
-
73
-
74
-
75
-
76
-
77
-
78
-
79
-
80
-
81
-
82
-
83
-
84
-
85
-
86
-
87
-
88
-
89
-
90
-
91
-
92
-
93
-
94
-
95
-
96
-
97
-
98
-
99
-
100
-
101
-
102
-
103
-
104
-
105
-
106
-
107
-
108
-
109
-
110
-
111
-
112
-
113
-
114
-
115
-
116
-
117
-
118
-
119
-
120
-
121
-
122
-
123
-
124
-
125
-
126
-
127
-
128
-
129
-
130
-
131
-
132
-
133
-
134
-
135
-
136
-
137
-
138
-
139
-
140
 |
 |

45
Management Discussion
International Business Machines Corporation and Subsidiary Companies
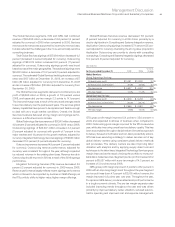
OEM revenue of $2,281 million in 2009 declined 15.2 percent
(15 percent adjusted for currency) compared to 2008 driven by
reduced demand year over year in the technology OEM business.
Year-to-year revenue performance improved in this business
across the second half of 2009.
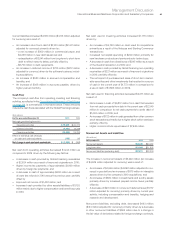
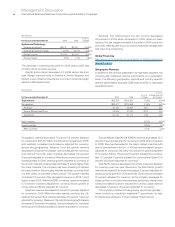
Total Expense and Other Income
($ in millions)
Yr.-to-Yr.
For the year ended December 31: 2009 2008 Change
Total expense and other income $25,647 $28,945 (11.4)%
Expense-to-revenue ratio 26.8% 27.9% (1.1) pts.
The key drivers year to year in total expense and other income were
approximately:
• Operational expense, (9) points
• Currency,* (4) points
• Acquisitions,** 1 point
* Reflects impacts of translation and hedging programs.
** Includes acquisitions completed in prior 12-month period.
In 2009, the company continued to execute its operational plan
to increase process efficiency and productivity; leveraging the
company’s scale and global presence. The company’s efforts have
been focused on all areas of the business—from sales efficiency,
supply chain management and service delivery to the global
support functions. The company’s cost and expense base
(approximately $80 billion) provides ample opportunity for
savings and the company yielded approximately $3.7 billion in
cost and expense savings in 2009. The company’s initiatives have
contributed to an improved operational balance point and the
improvements in margins and profit. As a result, the company is
able to continue to invest in capabilities that will differentiate the
company in the future and accelerate the development of new
market opportunities.
Total SG&A expense decreased 10.4 percent (8 percent adjusted
for currency) in 2009 versus 2008. Overall, the decrease was
driven by reductions in operational expense (down 9 points) as
the company continued to focus on disciplined expense manage-
ment, while investing for future growth. Currency impacts also
drove a year-to-year decline (down 3 points), partially offset by
acquisition-related spending (up 1 point). Workforce reductions
expense decreased $264 million, primarily due to actions taken
in the fourth quarter of 2008, reflecting workforce actions in Japan
($120 million) and other ongoing skills rebalancing that is a regular
element of the company’s business model. Bad debt expense
decreased $159 million primarily driven by reductions in specific
reserve requirements and lower accounts receivable balances in
2009 versus 2008. The company’s accounts receivable provision
coverage was 2.0 percent, flat compared to the prior year.
Other (income) and expense was income of $351 million in
2009, an increase in income of $53 million year to year. The
increase was driven by several key factors: the $298 million gain
from the core logistics operations divestiture; increased foreign
currency transaction gains of $329 million; offset by less interest
income of $249 million due to lower rates; less gains from securities
transactions of $162 million due to Lenovo equity sales in 2008;
and a 2009 loss provision related to a joint venture investment of
$119 million.
The company continues to invest in research and development,
focusing its investments on high-value, high-growth opportunities.
Total RD&E expense decreased 8.2 percent in 2009 versus 2008;
adjusted for currency, expense decreased 6 percent in 2009.
The decrease in spending, adjusted for currency, was driven by
continued process efficiencies and reductions in discretionary
spending, partially offset by the impact of acquisitions. RD&E
investments represented 6.1 percent of total revenue in 2009, flat
compared to 2008.
The timing and amount of sales and other transfers of IP may
vary significantly from period to period depending upon timing of
divestitures, industry consolidation, economic conditions and the
timing of new patents and know-how development. There were
no significant individual IP transactions in 2009 or 2008.
The decrease in interest expense was primarily due to lower
debt balances in 2009 versus 2008. Total debt at December 31,
2009 was $26.1 billion; a decline year to year of $7.8 billion of
primarily non-Global Financing debt. Overall interest expense for
2009 was $1,109 million, a decrease of $353 million versus 2008.
Income Taxes
The effective tax rate for 2009 was 26.0 percent, compared with
26.2 percent in 2008. The 0.2 point decrease was primarily driven
by a more favorable geographic mix of pre-tax income, the absence
of the 2008 tax cost impacts associated with the intercompany
transfer of certain intellectual property and the agreements reached
regarding the completion of the U.S. federal income tax examina-
tion for the years 2004 and 2005, including the associated income
tax reserve redeterminations. These benefits were offset by a
decrease in 2009 in the utilization of foreign tax credits.
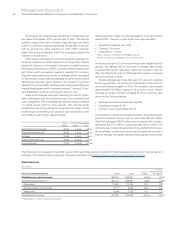
Financial Position
Total assets decreased $502 million (decreased $3,885 million
adjusted for currency) from December 31, 2008, driven by:
• Decreases in cash and cash equivalents ($558 million) and
total receivables ($1,301 million); and
•
Lower deferred taxes ($2,888 million) and intangible assets
($365 million); partially offset by
• Increased goodwill ($1,964 million) and prepaid pension assets
($1,401 million); and
• Higher level of marketable securities ($1,625 million).