IBM 2010 Annual Report Download - page 66
Download and view the complete annual report
Please find page 66 of the 2010 IBM annual report below. You can navigate through the pages in the report by either clicking on the pages listed below, or by using the keyword search tool below to find specific information within the annual report.-
 1
1 -
2
-
3
-
4
-
5
-
6
-
7
-
8
-
9
-
10
-
11
-
12
-
13
-
14
-
15
-
16
-
17
-
18
-
19
-
20
-
21
-
22
-
23
-
24
-
25
-
26
-
27
-
28
-
29
-
30
-
31
-
32
-
33
-
34
-
35
-
36
-
37
-
38
-
39
-
40
-
41
-
42
-
43
-
44
-
45
-
46
-
47
-
48
-
49
-
50
-
51
-
52
-
53
-
54
-
55
-
 56
56 -
 57
57 -
 58
58 -
 59
59 -
 60
60 -
 61
61 -
 62
62 -
 63
63 -
 64
64 -
 65
65 -
 66
66 -
 67
67 -
 68
68 -
 69
69 -
 70
70 -
 71
71 -
 72
72 -
 73
73 -
 74
74 -
 75
75 -
 76
76 -
77
-
78
-
79
-
80
-
81
-
82
-
83
-
84
-
85
-
86
-
87
-
88
-
89
-
90
-
91
-
92
-
93
-
94
-
95
-
96
-
97
-
98
-
99
-
100
-
101
-
102
-
103
-
104
-
105
-
106
-
107
-
108
-
109
-
110
-
111
-
112
-
113
-
114
-
115
-
116
-
117
-
118
-
119
-
120
-
121
-
122
-
123
-
124
-
125
-
126
-
127
-
128
-
129
-
130
-
131
-
132
-
133
-
134
-
135
-
136
-
137
-
138
-
139
-
140
 |
 |

64
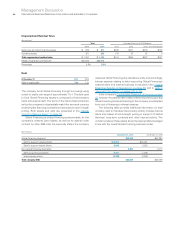
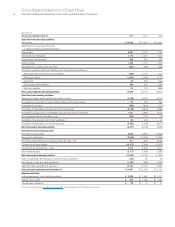
Consolidated Statement of Cash Flows
International Business Machines Corporation and Subsidiary Companies
($ in millions)
For the year ended December 31: 2010 2009 2008
Cash flow from operating activities:
Net income $ 14,833 $ 13,425 $ 12,334
Adjustments to reconcile net income
to cash provided by operating activities:
Depreciation 3,657 3,773 4,140
Amortization of intangibles 1,174 1,221 1,310
Stock-based compensation 629 558 659
Deferred taxes 1,294 1,773 1,900
Net (gain)/loss on asset sales and other (801) (395) (338)
Change in operating assets and liabilities, net of acquisitions/divestitures:
Receivables (including financing receivables) (489) 2,131 274
Retirement related (1,963) (2,465) (1,773)
Inventories 92 263 (102)
Other assets/other liabilities 949 319 1,268
Accounts payable 174 170 (860)
Net cash provided by operating activities 19,549 20,773 18,812
Cash flow from investing activities:
Payments for plant, rental machines and other property (4,185) (3,447) (4,171)
Proceeds from disposition of plant, rental machines and other property 770 330 350
Investment in software (569) (630) (716)
Purchases of marketable securities and other investments (6,129) (5,604) (4,590)
Proceeds from disposition of marketable securities and other investments 7,877 3,599 6,100
Non-operating finance receivables — net (405) (184) (16)
Divestiture of businesses, net of cash transferred 55 400 71
Acquisition of businesses, net of cash acquired (5,922) (1,194) (6,313)
Net cash used in investing activities (8,507) (6,729) (9,285)
Cash flow from financing activities:
Proceeds from new debt 8,055 6,683 13,829
Payments to settle debt (6,522) (13,495) (10,248)
Short-term (repayments)/borrowings less than 90 days — net 817 (651) (6,025)
Common stock repurchases (15,375) (7,429) (10,578)
Common stock transactions — other 3,774 3,052 3,774
Cash dividends paid (3,177) (2,860) (2,585)
Net cash used in financing activities (12,429) (14,700) (11,834)
Effect of exchange rate changes on cash and cash equivalents (135) 98 58
Net change in cash and cash equivalents (1,522) (558) (2,250)
Cash and cash equivalents at January 1 12,183 12,741 14,991
Cash and cash equivalents at December 31 $ 10,661 $ 12,183 $ 12,741
Supplemental data:
Income taxes paid — net of refunds received $ 3,238 $ 1,567 $ 2,111
Interest paid on debt $ 951 $ 1,240 $ 1,460
Capital lease obligations $ 30 $ 15 $ 41
The accompanying notes on pages 68 through 130 are an integral part of the financial statements.