IBM 2010 Annual Report Download - page 38
Download and view the complete annual report
Please find page 38 of the 2010 IBM annual report below. You can navigate through the pages in the report by either clicking on the pages listed below, or by using the keyword search tool below to find specific information within the annual report.-
 1
1 -
2
-
3
-
4
-
5
-
6
-
7
-
8
-
9
-
10
-
11
-
12
-
13
-
14
-
15
-
16
-
17
-
18
-
19
-
20
-
21
-
22
-
23
-
24
-
25
-
26
-
27
-
 28
28 -
 29
29 -
 30
30 -
 31
31 -
 32
32 -
 33
33 -
 34
34 -
 35
35 -
 36
36 -
 37
37 -
 38
38 -
 39
39 -
 40
40 -
 41
41 -
 42
42 -
 43
43 -
 44
44 -
 45
45 -
 46
46 -
 47
47 -
 48
48 -
49
-
50
-
51
-
52
-
53
-
54
-
55
-
56
-
57
-
58
-
59
-
60
-
61
-
62
-
63
-
64
-
65
-
66
-
67
-
68
-
69
-
70
-
71
-
72
-
73
-
74
-
75
-
76
-
77
-
78
-
79
-
80
-
81
-
82
-
83
-
84
-
85
-
86
-
87
-
88
-
89
-
90
-
91
-
92
-
93
-
94
-
95
-
96
-
97
-
98
-
99
-
100
-
101
-
102
-
103
-
104
-
105
-
106
-
107
-
108
-
109
-
110
-
111
-
112
-
113
-
114
-
115
-
116
-
117
-
118
-
119
-
120
-
121
-
122
-
123
-
124
-
125
-
126
-
127
-
128
-
129
-
130
-
131
-
132
-
133
-
134
-
135
-
136
-
137
-
138
-
139
-
140
 |
 |

36
Management Discussion
International Business Machines Corporation and Subsidiary Companies
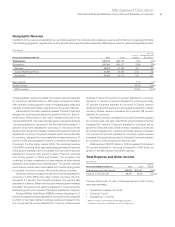
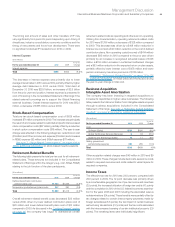
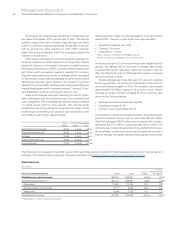
Debt
The company’s funding requirements are continually monitored
and strategies are executed to manage the overall asset and liability
profile. Additionally, the company maintains sufficient flexibility to
access global funding sources as needed.
($ in millions)
At December 31: 2010 2009
Total company debt $28,624 $26,099
Total Global Financing segment debt: $22,823 $22,383
Debt to support external clients 19,583 19,091
Debt to support internal clients 3,240 3,292
Global Financing provides financing predominantly for the company’s
external client assets, as well as for assets under contract by other
IBM units. These assets, primarily for Global Services, generate
long-term, stable revenue streams similar to the Global Financing
asset portfolio. Based on their attributes, these Global Services
assets are leveraged with the balance of the Global Financing
asset base. The debt analysis above is further detailed in the
Global Financing section on page 58.
Given the significant leverage, the company presents a debt-
to-capitalization ratio which excludes Global Financing debt and
equity as management believes this is more representative of the
company’s core business operations. This ratio can vary from
period to period as the company manages its global cash and
debt positions.
“Core” debt-to-capitalization ratio (excluding Global Financing
debt and equity) was 22.6 percent at December 31, 2010 compared
to 16.0 percent at December 31, 2009. The increase was primarily
driven by an increase in non-Global Financing debt of $2,084 million.
With this amount of leverage, the company continues to have a high
degree of financial flexibility.
Consolidated debt-to-capitalization ratio at December 31, 2010
was 55.3 percent versus 53.4 percent at December 31, 2009.
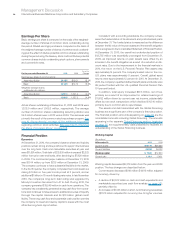
Equity
Total equity increased $418 million primarily as a result of an
increase in retained earnings of $11,632 million and an increase of
$3,608 million in common stock, substantially offset by an increase
in treasury stock of $14,918 million driven by common stock
repurchases during 2010.
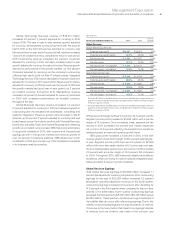
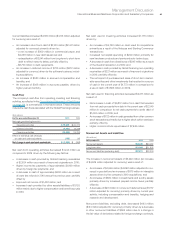
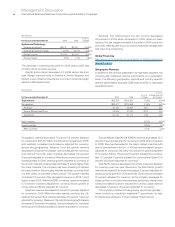
Consolidated Fourth-Quarter Results
($ and shares in millions except per share amounts)
Yr.-to-Yr.
Percent/
Margin
For the fourth quarter: 2010 2009 Change
Revenue $29,019 $27,230 6.6%*
Gross profit margin 49.0% 48.3% 0.8 pts.
Total expense and other income $ 7,271 $ 6,765 7.5%
Total expense and other
income-to-revenue ratio 25.1% 24.8% 0.2 pts.
Income before income taxes $ 6,956 $ 6,381 9.0%
Provision for income taxes 1,698 1,568 8.3%
Net income $ 5,257 $ 4,813 9.2%
Net income margin 18.1% 17.7% 0.4 pts.
Earnings per share of common stock:
Assuming dilution $ 4.18 $ 3.59 16.4%
Weighted-average shares outstanding:
Assuming dilution 1,258.4 1,340.7 (6.1)%
* 7.1 percent adjusted for currency.
Snapshot
The fourth quarter of 2010 capped off a very good year as the
company continued the trend of improving business performance,
increasing constant currency revenue growth, expanding margins
and again delivering double-digit earnings per share growth. Diluted
earnings per share of $4.18 increased 16.4 percent versus the fourth
quarter of 2009 and represented the 32nd consecutive quarter of
earnings per share growth for the company. The company delivered
solid financial results while continuing a high level of investment to
drive future growth and delivering strong shareholder returns.
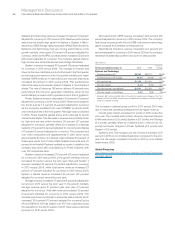
Total revenue increased 6.6 percent as reported (7 percent
adjusted for currency) versus the fourth quarter of 2009 driven by
hardware and software. This was the highest quarterly constant
currency revenue growth rate in nearly a decade. Systems and
Technology revenue increased 21.0 percent (22 percent adjusted
for currency) with growth in every platform and strong performance
in the System z mainframe product. Software revenue increased
7.0 percent (8 percent adjusted for currency) as reported, and was
up 10.5 percent (12 percent adjusted for currency) without the
divested PLM operations. Software’s 12 percent growth at constant
currency was double the growth rate of its strong performance in
the first three quarters of the year. Total Global Services revenue
growth of 2.0 percent (2 percent adjusted for currency) was con-
sistent with third-quarter 2010 performance. The estimated Global
Services backlog at actual currency rates was $142 billion, an
increase of $5 billion ($4 billion adjusted for currency) compared
to the December 31, 2009 level and an increase of $8 billion ($7
billion adjusted for currency) from September 30, 2010. From a
geographic perspective, major markets revenue increased 3.9
percent (5 percent adjusted for currency) led by constant currency
growth in the U.S., France and Italy. Total revenue in the growth
markets increased 15.4 percent (13 percent adjusted for currency)