IBM 2010 Annual Report Download - page 92
Download and view the complete annual report
Please find page 92 of the 2010 IBM annual report below. You can navigate through the pages in the report by either clicking on the pages listed below, or by using the keyword search tool below to find specific information within the annual report.-
 1
1 -
2
-
3
-
4
-
5
-
6
-
7
-
8
-
9
-
10
-
11
-
12
-
13
-
14
-
15
-
16
-
17
-
18
-
19
-
20
-
21
-
22
-
23
-
24
-
25
-
26
-
27
-
28
-
29
-
30
-
31
-
32
-
33
-
34
-
35
-
36
-
37
-
38
-
39
-
40
-
41
-
42
-
43
-
44
-
45
-
46
-
47
-
48
-
49
-
50
-
51
-
52
-
53
-
54
-
55
-
56
-
57
-
58
-
59
-
60
-
61
-
62
-
63
-
64
-
65
-
66
-
67
-
68
-
69
-
70
-
71
-
72
-
73
-
74
-
75
-
76
-
77
-
78
-
79
-
80
-
81
-
 82
82 -
 83
83 -
 84
84 -
 85
85 -
 86
86 -
 87
87 -
 88
88 -
 89
89 -
 90
90 -
 91
91 -
 92
92 -
 93
93 -
 94
94 -
 95
95 -
 96
96 -
 97
97 -
 98
98 -
 99
99 -
 100
100 -
 101
101 -
 102
102 -
103
-
104
-
105
-
106
-
107
-
108
-
109
-
110
-
111
-
112
-
113
-
114
-
115
-
116
-
117
-
118
-
119
-
120
-
121
-
122
-
123
-
124
-
125
-
126
-
127
-
128
-
129
-
130
-
131
-
132
-
133
-
134
-
135
-
136
-
137
-
138
-
139
-
140
 |
 |

Notes to Consolidated Financial Statements
International Business Machines Corporation and Subsidiary Companies90
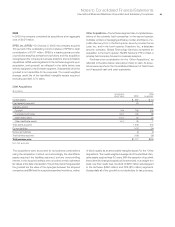
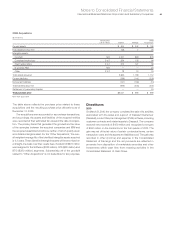
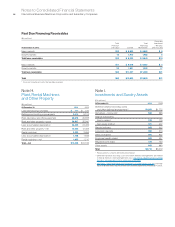
Note F.
Inventories
($ in millions)
At December 31: 2010 2009
Finished goods $ 432 $ 533
Work in process and raw materials 2,018 1,960
Tot a l $2,450 $2,494
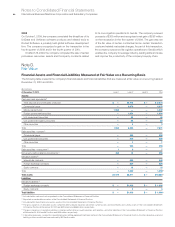
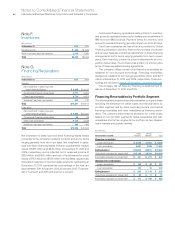
Note G.
Financing Receivables
($ in millions)
At December 31: 2010 2009
Current:
Net investment in sales-type and
direct financing leases $ 3,945 $ 4,105
Commercial financing receivables 6,777 5,604
Client loan receivables 4,718 4,475
Installment payment receivables 816 730
Tot a l $16,257 $14,914
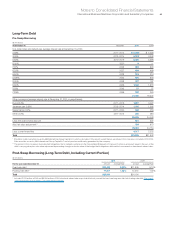
Long-term:
Net investment in sales-type and
direct financing leases $ 5,384 $ 5,331
Commercial financing receivables 43 58
Client loan receivables 4,734 4,759
Installment payment receivables 388 496
Tot a l $10,548 $10,644
Net investment in sales-type and direct financing leases relates
principally to the company’s systems products and are for terms
ranging generally from two to six years. Net investment in sales-
type and direct financing leases includes unguaranteed residual
values of $871 million and $849 million at December 31, 2010 and
2009, respectively, and is reflected net of unearned income of
$816 million and $905 million and net of the allowance for credit
losses of $151 million and $159 million at those dates, respectively.
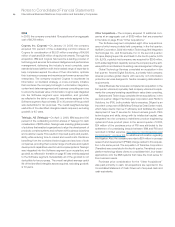
Scheduled maturities of minimum lease payments outstanding at
December 31, 2010, expressed as a percentage of the total, are
approximately: 2011, 46 percent; 2012, 29 percent; 2013, 17 percent;
2014, 7 percent; and 2015 and beyond, 2 percent.
Commercial financing receivables relate primarily to inventory
and accounts receivable financing for dealers and remarketers of
IBM and non-IBM products. Payment terms for inventory and
accounts receivable financing generally range from 30 to 90 days.
Client loan receivables are loans that are provided by Global
Financing primarily to clients to finance the purchase of software
and services. Separate contractual relationships on these financing
arrangements are for terms ranging generally from two to seven
years. Each financing contract is priced independently at com-
petitive market rates. The company has a history of enforcing the
terms of these separate financing agreements.
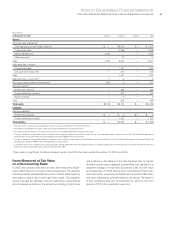
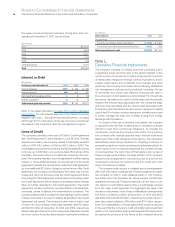
The company utilizes certain of its financing receivables as
collateral for non-recourse borrowings. Financing receivables
pledged as collateral for borrowings were $302 million and $271
million at December 31, 2010 and 2009, respectively. These bor-
rowings are included in note K, “Borrowings,” on pages 94 to 96.
The company did not have any financing receivables held for
sale as of December 31, 2010 and 2009.
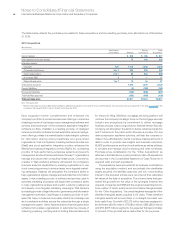
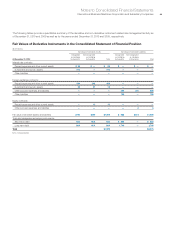
Financing Receivables by Portfolio Segment
The following table presents financing receivables on a gross basis
excluding the allowance for credit losses and residual value, by
portfolio segment and by class, excluding current commercial
financing receivables and other miscellaneous financing receiv-
ables. The company determines its allowance for credit losses
based on two portfolio segments: lease receivables and loan
receivables and further segments the portfolio via two classes:
major markets and growth markets.
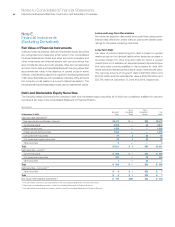
($ in millions)
Major Growth
At December 31, 2010: Markets Markets Total
Financing receivables:
Lease receivables $ 6,562 $1,983 $ 8,545
Loan receivables 9,087 1,993 11,080
Ending balance $15,650 $3,975 $19,625
Collectively evaluated for impairment $15,199 $3,794 $18,993
Individually evaluated for impairment $ 451 $ 181 $ 632
Allowance for credit losses:
Lease receivables $ 109 $ 42 $ 151
Loan receivables 125 76 201
Ending balance $ 234 $ 119 $ 353
Collectively evaluated for impairment $ 60 $ 11 $ 71
Individually evaluated for impairment $ 174 $ 108 $ 282