IBM 2010 Annual Report Download - page 108
Download and view the complete annual report
Please find page 108 of the 2010 IBM annual report below. You can navigate through the pages in the report by either clicking on the pages listed below, or by using the keyword search tool below to find specific information within the annual report.-
 1
1 -
2
-
3
-
4
-
5
-
6
-
7
-
8
-
9
-
10
-
11
-
12
-
13
-
14
-
15
-
16
-
17
-
18
-
19
-
20
-
21
-
22
-
23
-
24
-
25
-
26
-
27
-
28
-
29
-
30
-
31
-
32
-
33
-
34
-
35
-
36
-
37
-
38
-
39
-
40
-
41
-
42
-
43
-
44
-
45
-
46
-
47
-
48
-
49
-
50
-
51
-
52
-
53
-
54
-
55
-
56
-
57
-
58
-
59
-
60
-
61
-
62
-
63
-
64
-
65
-
66
-
67
-
68
-
69
-
70
-
71
-
72
-
73
-
74
-
75
-
76
-
77
-
78
-
79
-
80
-
81
-
82
-
83
-
84
-
85
-
86
-
87
-
88
-
89
-
90
-
91
-
92
-
93
-
94
-
95
-
96
-
97
-
 98
98 -
 99
99 -
 100
100 -
 101
101 -
 102
102 -
 103
103 -
 104
104 -
 105
105 -
 106
106 -
 107
107 -
 108
108 -
 109
109 -
 110
110 -
 111
111 -
 112
112 -
 113
113 -
 114
114 -
 115
115 -
 116
116 -
 117
117 -
 118
118 -
119
-
120
-
121
-
122
-
123
-
124
-
125
-
126
-
127
-
128
-
129
-
130
-
131
-
132
-
133
-
134
-
135
-
136
-
137
-
138
-
139
-
140
 |
 |

Notes to Consolidated Financial Statements
International Business Machines Corporation and Subsidiary Companies106
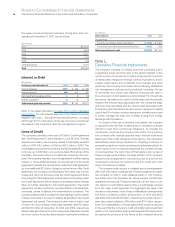
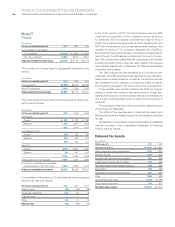
Note P.
Ta xes
($ in millions)
For the year ended December 31: 2010 2009 2008
Income before income taxes:
U.S. operations $ 9,140 $ 9,524 $ 8,424
Non-U.S. operations 10,583 8,614 8,291
Total income before income taxes $19,723 $18,138 $16,715
The provision for income taxes by geographic operations is as
follows:
($ in millions)
For the year ended December 31: 2010 2009 2008
U.S. operations $2,000 $2,427 $2,348
Non-U.S. operations 2,890 2,286 2,033
Total provision for income taxes $4,890 $4,713 $4,381
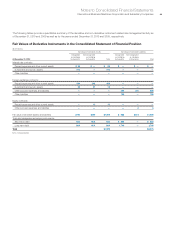
The components of the provision for income taxes by taxing juris-
diction are as follows:
($ in millions)
For the year ended December 31: 2010 2009 2008
U.S. federal:
Current $ 190 $ 473 $ 338
Deferred 1,015 1,341 1,263
1,205 1,814 1,601
U.S. state and local:
Current 279 120 216
Deferred 210 185 205
489 305 421
Non-U.S.:
Current 3,127 2,347 1,927
Deferred 69 247 432
3,196 2,594 2,359
Total provision for income taxes 4,890 4,713 4,381
Provision for social security, real estate,
personal property and other taxes 4,018 3,986 4,076
Total taxes included in net income $8,908 $8,699 $8,457
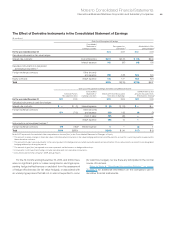
A reconciliation of the statutory U.S. federal tax rate to the company’s
effective tax rate is as follows:
For the year ended December 31: 2010 2009 2008
Statutory rate 35% 35% 35%
Foreign tax differential (10) (9) (8)
State and local 2 1 1
Other (2) (1) (2)
Effective rate 25% 26% 26%
In the fourth quarter of 2010, the Internal Revenue Service (IRS)
concluded its examination of the company’s income tax returns
for 2006 and 2007 and issued a final Revenue Agent’s Report
(RAR). The company has agreed with all of the adjustments in the
RAR with the exception of proposed adjustments relating to the
valuation of certain IP. The company disagrees with the IRS on
these specific matters and intends to contest the proposed adjust-
ments through the IRS appeals process and the courts, if neces-
sary. The company has redetermined its unrecognized tax benefits,
including all similar items in open tax years, based on the agreed
and disputed adjustments contained in the RAR and associated
information and analysis.
The 2010 effective tax rate benefited by 6.4 points from the
completion of the IRS examination discussed above including asso-
ciated reserve redeterminations. In addition, the effective tax rate
also benefited from the utilization of foreign tax credits as well as
the company’s geographic mix of pre-tax income and incentives.
These benefits were partially offset by the 2010 tax charges
related to certain intercompany payments made by foreign sub-
sidiaries, tax impacts of certain business restructuring transactions
and the tax costs associated with the intercompany licensing of
certain IP.
The net impact of the above items is primarily reflected as part
of the foreign tax differential.
The effect of tax law changes on deferred tax assets and
liabilities did not have a material impact on the company’s effective
tax rate.
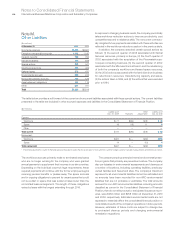
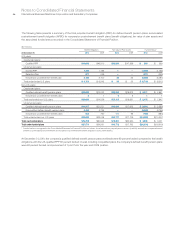
The significant components of deferred tax assets and liabilities
that are recorded in the Consolidated Statement of Financial
Position were as follows:
Deferred Tax Assets
($ in millions)
At December 31: 2010 2009
Retirement benefits $ 4,131 $ 3,921
Share-based and other compensation 1,570 1,853
Deferred income 1,080 847
Domestic tax loss/credit carryforwards 948 859
Foreign tax loss/credit carryforwards 758 680
Bad debt, inventory and warranty reserves 564 605
Depreciation 470 485
Capitalized research and development 291 539
Other 1,486 1,999
Gross deferred tax assets 11,298 11,788
Less: valuation allowance 795 812
Net deferred tax assets $10,503 $10,976