IBM 2010 Annual Report Download - page 118
Download and view the complete annual report
Please find page 118 of the 2010 IBM annual report below. You can navigate through the pages in the report by either clicking on the pages listed below, or by using the keyword search tool below to find specific information within the annual report.-
 1
1 -
2
-
3
-
4
-
5
-
6
-
7
-
8
-
9
-
10
-
11
-
12
-
13
-
14
-
15
-
16
-
17
-
18
-
19
-
20
-
21
-
22
-
23
-
24
-
25
-
26
-
27
-
28
-
29
-
30
-
31
-
32
-
33
-
34
-
35
-
36
-
37
-
38
-
39
-
40
-
41
-
42
-
43
-
44
-
45
-
46
-
47
-
48
-
49
-
50
-
51
-
52
-
53
-
54
-
55
-
56
-
57
-
58
-
59
-
60
-
61
-
62
-
63
-
64
-
65
-
66
-
67
-
68
-
69
-
70
-
71
-
72
-
73
-
74
-
75
-
76
-
77
-
78
-
79
-
80
-
81
-
82
-
83
-
84
-
85
-
86
-
87
-
88
-
89
-
90
-
91
-
92
-
93
-
94
-
95
-
96
-
97
-
98
-
99
-
100
-
101
-
102
-
103
-
104
-
105
-
106
-
107
-
 108
108 -
 109
109 -
 110
110 -
 111
111 -
 112
112 -
 113
113 -
 114
114 -
 115
115 -
 116
116 -
 117
117 -
 118
118 -
 119
119 -
 120
120 -
 121
121 -
 122
122 -
 123
123 -
 124
124 -
 125
125 -
 126
126 -
 127
127 -
 128
128 -
129
-
130
-
131
-
132
-
133
-
134
-
135
-
136
-
137
-
138
-
139
-
140
 |
 |

Notes to Consolidated Financial Statements
International Business Machines Corporation and Subsidiary Companies116
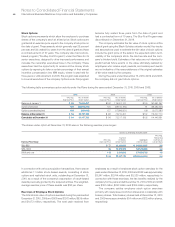
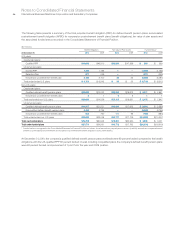
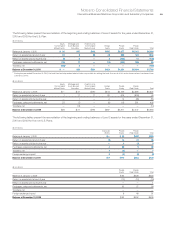
The following table presents the changes in benefit obligations and plan assets of the company’s retirement-related benefit plans, excluding
defined contribution plans.
($ in millions)
Defined Benefit Pension Plans Nonpension Postretirement Benefit Plans
U.S. Plans Non-U.S. Plans* U.S. Plan Non-U.S. Plans
2010 2009 2010 2009 2010 2009 2010 2009
Change in benefit obligation:
Benefit obligation at January 1 $48,354 $48,756 $41,308 $39,171 $ 5,100 $ 5,224 $ 767 $ 608
Service cost — — 508 585 33 41 9 10
Interest cost 2,601 2,682 1,841 1,898 262 289 59 51
Plan participants’ contributions — — 57 58 235 228 — —
Acquisitions/divestitures, net — — (75) (58) — — 1 (2)
Actuarial losses/(gains) 3,573 155 1,656 506 123 (65) 32 14
Benefits paid from trust (3,145) (3,144) (1,957) (1,855) (641) (646) (7) (6)
Direct benefit payments (92) (94) (457) (464) (5) (25) (25) (23)
Foreign exchange impact — — (225) 1,920 — — 37 111
Medicare subsidy — — — — 16 52 — —
Plan amendments/curtailments/settlements 1 — (73) (454) — — 0 4
Benefit obligation at December 31 $51,293 $48,354 $42,584 $41,308 $ 5,123 $ 5,100 $ 872 $ 767
Change in plan assets:
Fair value of plan assets at January 1 $47,269 $45,918 $34,305 $29,164 $ 33 $ 113 $ 104 $ 79
Actual return on plan assets 6,135 4,496 2,983 4,030 0 (1) 17 8
Employer contributions — — 801 1,195 408 338 0 1
Acquisitions/divestitures, net — — (10) (29) (0) — (0) —
Plan participants’ contributions — — 57 58 235 228 — —
Benefits paid from trust (3,145) (3,144) (1,957) (1,855) (641) (646) (7) (6)
Foreign exchange impact — — (396) 1,710 — — 6 23
Plan amendments/curtailments/settlements — — (61) 33 — — — (1)
Fair value of plan assets at December 31 $50,259 $47,269 $35,722 $34,305 $ 35 $ 33 $ 120 $ 104
Funded status at December 31 $ (1,034) $ (1,085) $ (6,861) $ (7,003) $(5,088) $(5,067) $(752) $(663)
Accumulated benefit obligation** $51,293 $48,354 $41,630 $40,339 N/A N/A N/A N/A
* Excludes a defined benefit pension plan in Brazil due to restrictions on the use of plan assets imposed by governmental regulations.
** Represents the benefit obligation assuming no future participant compensation increases.
N/A—Not applicable
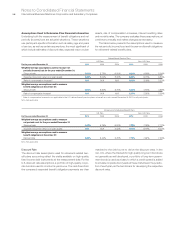
The following table presents the net funded status recognized in the Consolidated Statement of Financial Position.
($ in millions)
Defined Benefit Pension Plans Nonpension Postretirement Benefit Plans
U.S. Plans Non-U.S. Plans U.S. Plan Non-U.S. Plans
At December 31: 2010 2009 2010 2009 2010 2009 2010 2009
Prepaid pension assets $ 596 $ 359 $ 2,471 $ 2,641 $ 0 $ — $ 1 $ 1
Current liabilities—compensation and benefits (94) (91) (289) (326) (421) (425) (22) (24)
Noncurrent liabilities—retirement and
nonpension postretirement benefit obligations (1,536) (1,353) (9,044) (9,318) (4,667) (4,642) (731) (640)
Funded status — net $(1,034) $(1,085) $(6,861) $(7,003) $(5,088) $(5,067) $(752) $(663)
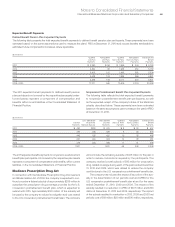
The table on page 117 presents the pre-tax net loss and prior service costs/(credits) and transition (assets)/liabilities recognized in other
comprehensive income/(loss) and the changes in the pre-tax net loss, prior service costs/(credits) and transition (assets)/liabilities
recognized in accumulated other comprehensive income/(loss) for the retirement-related benefit plans.