IBM 2010 Annual Report Download - page 43
Download and view the complete annual report
Please find page 43 of the 2010 IBM annual report below. You can navigate through the pages in the report by either clicking on the pages listed below, or by using the keyword search tool below to find specific information within the annual report.-
 1
1 -
2
-
3
-
4
-
5
-
6
-
7
-
8
-
9
-
10
-
11
-
12
-
13
-
14
-
15
-
16
-
17
-
18
-
19
-
20
-
21
-
22
-
23
-
24
-
25
-
26
-
27
-
28
-
29
-
30
-
31
-
32
-
 33
33 -
 34
34 -
 35
35 -
 36
36 -
 37
37 -
 38
38 -
 39
39 -
 40
40 -
 41
41 -
 42
42 -
 43
43 -
 44
44 -
 45
45 -
 46
46 -
 47
47 -
 48
48 -
 49
49 -
 50
50 -
 51
51 -
 52
52 -
 53
53 -
54
-
55
-
56
-
57
-
58
-
59
-
60
-
61
-
62
-
63
-
64
-
65
-
66
-
67
-
68
-
69
-
70
-
71
-
72
-
73
-
74
-
75
-
76
-
77
-
78
-
79
-
80
-
81
-
82
-
83
-
84
-
85
-
86
-
87
-
88
-
89
-
90
-
91
-
92
-
93
-
94
-
95
-
96
-
97
-
98
-
99
-
100
-
101
-
102
-
103
-
104
-
105
-
106
-
107
-
108
-
109
-
110
-
111
-
112
-
113
-
114
-
115
-
116
-
117
-
118
-
119
-
120
-
121
-
122
-
123
-
124
-
125
-
126
-
127
-
128
-
129
-
130
-
131
-
132
-
133
-
134
-
135
-
136
-
137
-
138
-
139
-
140
 |
 |

41
Management Discussion
International Business Machines Corporation and Subsidiary Companies
The Global Services segments, GTS and GBS, had combined
revenue of $55,000 million, a decrease of 6.6 percent (4 percent
adjusted for currency) in 2009 when compared to 2008. Services
revenue performance was supported by its annuity revenue base,
but also reflected the challenges in the more economically sensitive
consulting business.
Total Global Services signings of $57,094 million decreased 0.2
percent (increased 2 percent adjusted for currency). Outsourcing
signings of $33,014 million increased 8.8 percent (11 percent
adjusted for currency). Outsourcing signings growth was broad
based across all the major geographies. Transactional signings were
$24,081 million, a decrease of 10.2 percent (8 percent adjusted for
currency). The estimated Global Services backlog at actual currency
rates was $137 billion at December 31, 2009, an increase of $7
billion ($1 billion adjusted for currency) from December 31, 2008
and an increase of $2 billion ($3 billion adjusted for currency) from
September 30, 2009.
The Global Services segments delivered a combined pre-tax
profit of $8,092 million in 2009, a growth of 11.0 percent versus
2008, and expanded pre-tax margin 2.3 points to 14.1 percent.
The improved margin was a result of the structural changes made
to services delivery over the past several years. The services global
delivery capabilities have proven to be dynamic and flexible enough
to deal with very tough market conditions. Overall, the Global
Services business delivered strong margin and signings perfor-
mance in a difficult economic climate.
Global Technology Services revenue of $37,347 million decreased
4.9 percent (2 percent adjusted for currency) in 2009 versus 2008.
Outsourcing signings of $25,507 million increased 4.3 percent
(8 percent adjusted for currency) with growth of 7 percent in the
major markets and 14 percent in the growth markets, adjusted for
currency. Integrated Technology Services signings of $9,196 million
decreased 10.3 percent (8 percent adjusted for currency).
Outsourcing revenue decreased 4.9 percent (2 percent adjusted
for currency). Outsourcing revenue performance, adjusted for
currency, was consistent throughout the year, although impac ted
by reduced volumes in the existing client base. Revenue trends in
Outsourcing should improve in 2010 as a result of the 2009 signings
performance.
Integrated Technology Services (ITS) revenue decreased 5.5
percent (3 percent adjusted for currency) in 2009 versus 2008.
Revenue performance largely reflects recent signings performance
which continued to be impacted by declines in OEM offerings, as
the ITS portfolio shifts to higher value, higher margin offerings.
Global Business Services revenue decreased 10.1 percent
(8 percent adjusted for currency) in 2009 driven primarily by a
double-digit decline in Consulting and Systems Integration revenue.
Application Outsourcing signings increased 27.1 percent (25 per-
cent adjusted for currency), illustrating the strong value proposition
Application Outsourcing can provide to clients with compelling
cost savings. Consulting and Systems Integration signings decreased
10.2 percent (8 percent adjusted for currency).
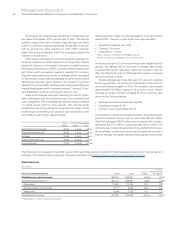
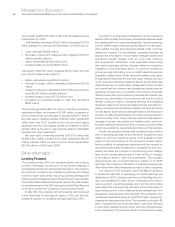
($ in millions)
Yr.-to-Yr.
For the year ended December 31: 2009 2008 Change
Global Services:
Global Technology Services:
External gross profit $13,081 $12,802 2.2%
External gross profit margin 35.0% 32.6% 2.4 pts.
Pre-tax income $ 5,537 $ 4,607 20.2%
Pre-tax margin 14.3% 11.3% 3.0 pts.
Global Business Services:
External gross profit $ 4,979 $ 5,238 (4.9)%
External gross profit margin 28.2% 26.7% 1.5 pts.
Pre-tax income $ 2,555 $ 2,681 (4.7)%
Pre-tax margin 13.8% 13.0% 0.8 pts.
GTS gross profit margin improved 2.4 points to 35.0 percent in
2009 and expanded in all lines of business when compared to
2008. Outsourcing gross margin improved for the fifth con secutive
year, while also improving overall service delivery quality. This has
been accomplished through a disciplined and inno vative approach
to delivery focused on both labor and non-labor productivity actions.
GTS has been executing a strategy to deliver services out of key
global delivery centers using consistent global delivery methods
and processes. The delivery centers are also improving labor
utilization with analytics and by applying supply chain tools and
techniques to the labor base. Integrated Technology Services gross
margin improved as the result of mixing the portfolio to more prof-
itable labor-based services. Segment pre-tax profit increased 20.2
percent to $5,537 million with a pre-tax margin of 14.3 percent, an
increase of 3.0 points versus 2008.
GBS gross profit margin improved 1.5 points to 28.2 percent in
2009 with an improving margin trend throughout the year. Segment
pre-tax profit was down 4.7 percent to $2,555 million, however, the
margin improved 0.8 points year over year. Throughout the year,
the dynamic GBS delivery model enabled solid profit performance
in a tough economic climate. The pre-tax margin expansion also
included improving trends throughout the year and was driven
primarily by improved delivery center utilization, reduced subcon-
tractor spending and improved cost and expense management.