IBM 2010 Annual Report Download - page 88
Download and view the complete annual report
Please find page 88 of the 2010 IBM annual report below. You can navigate through the pages in the report by either clicking on the pages listed below, or by using the keyword search tool below to find specific information within the annual report.-
 1
1 -
2
-
3
-
4
-
5
-
6
-
7
-
8
-
9
-
10
-
11
-
12
-
13
-
14
-
15
-
16
-
17
-
18
-
19
-
20
-
21
-
22
-
23
-
24
-
25
-
26
-
27
-
28
-
29
-
30
-
31
-
32
-
33
-
34
-
35
-
36
-
37
-
38
-
39
-
40
-
41
-
42
-
43
-
44
-
45
-
46
-
47
-
48
-
49
-
50
-
51
-
52
-
53
-
54
-
55
-
56
-
57
-
58
-
59
-
60
-
61
-
62
-
63
-
64
-
65
-
66
-
67
-
68
-
69
-
70
-
71
-
72
-
73
-
74
-
75
-
76
-
77
-
 78
78 -
 79
79 -
 80
80 -
 81
81 -
 82
82 -
 83
83 -
 84
84 -
 85
85 -
 86
86 -
 87
87 -
 88
88 -
 89
89 -
 90
90 -
 91
91 -
 92
92 -
 93
93 -
 94
94 -
 95
95 -
 96
96 -
 97
97 -
 98
98 -
99
-
100
-
101
-
102
-
103
-
104
-
105
-
106
-
107
-
108
-
109
-
110
-
111
-
112
-
113
-
114
-
115
-
116
-
117
-
118
-
119
-
120
-
121
-
122
-
123
-
124
-
125
-
126
-
127
-
128
-
129
-
130
-
131
-
132
-
133
-
134
-
135
-
136
-
137
-
138
-
139
-
140
 |
 |

Notes to Consolidated Financial Statements
International Business Machines Corporation and Subsidiary Companies86
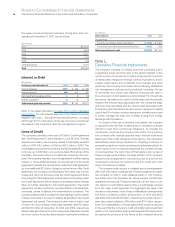
Note D.
Fair Value
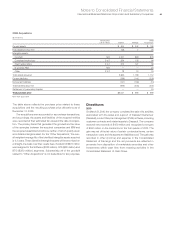
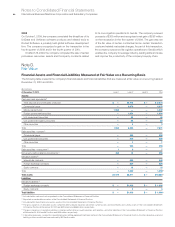
Financial Assets and Financial Liabilities Measured at Fair Value on a Recurring Basis
The following table presents the company’s financial assets and financial liabilities that are measured at fair value on a recurring basis at
December 31, 2010 and 2009.
($ in millions)
At December 31, 2010: Level 1 Level 2 Level 3 Total
Assets:
Cash and cash equivalents(1)
Time deposits and certificates of deposit $ — $2,473 $ — $ 2,473
Commercial paper — 2,673 — 2,673
Money market funds 1,532 — — 1,532
Foreign government securities — 1,054 — 1,054
U.S. government securities — 44 — 44
U.S. government agency securities — 22 — 22
Other securities — 3 — 3
Tota l 1,532 6,269 — 7,801
Debt securities—current
(2)
Commercial paper — 490 — 490
U.S. government securities — 500 — 500
Other securities — 1 — 1
Tota l — 990 — 990
Debt securities—noncurrent
(3) 1 6 — 7
Non-equity method alliance investments
(3) 445 13 — 458
Derivative assets
(4)
Interest rate contracts — 548 — 548
Foreign exchange contracts — 539 — 539
Equity contracts — 12 — 12
To t a l — 1,099 — 1,099
(6)
Total assets $1,978 $8,377 $ — $10,355 (6)
Liabilities:
Derivative liabilities
(5)
Foreign exchange contracts $ — $1,003 $ — $ 1,003
Equity contracts — 3 — 3
Total liabilities $ — $1,006 $ — $ 1,006
(6)
(1) Included within cash and cash equivalents in the Consolidated Statement of Financial Position.
(2)
Reported as marketable securities in the Consolidated Statement of Financial Position.
(3) Included within investments and sundry assets in the Consolidated Statement of Financial Position.
(4)
The gross balances of derivative assets contained within prepaid expenses and other current assets, and investments and sundry assets in the Consolidated Statement
of Financial Position at December 31, 2010 are $511 million and $588 million, respectively.
(5) The gross balances of derivative liabilities contained within other accrued expenses and liabilities, and other liabilities in the Consolidated Statement of Financial Position
at December 31, 2010 are $871 million and $135 million, respectively.
(6) If derivative exposures covered by a qualifying master netting agreement had been netted in the Consolidated Statement of Financial Position, the total derivative asset and
liability positions would have been reduced by $475 million each.
2009
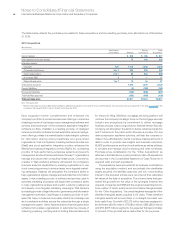
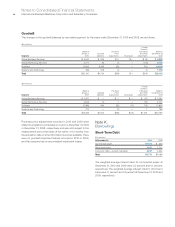
On October 1, 2009, the company completed the divestiture of its
UniData and UniVerse software products and related tools to
Rocket Software, a privately held global software development
firm. The company recognized a gain on the transaction in the
fourth quarter of 2009 and in the fourth quarter of 2010.
On March 16, 2009, the company completed the sale of certain
processes, resources, assets and third-party contracts related
to its core logistics operations to Geodis. The company received
proceeds of $365 million and recognized a net gain of $298 million
on the transaction in the first quarter of 2009. The gain was net
of the fair value of certain contractual terms, certain transaction
costs and related real estate charges. As part of this transaction,
the company outsourced its logistics operations to Geodis which
enables the company to leverage industry-leading skills and scale
and improve the productivity of the company’s supply chain.