IBM 2010 Annual Report Download - page 44
Download and view the complete annual report
Please find page 44 of the 2010 IBM annual report below. You can navigate through the pages in the report by either clicking on the pages listed below, or by using the keyword search tool below to find specific information within the annual report.-
 1
1 -
2
-
3
-
4
-
5
-
6
-
7
-
8
-
9
-
10
-
11
-
12
-
13
-
14
-
15
-
16
-
17
-
18
-
19
-
20
-
21
-
22
-
23
-
24
-
25
-
26
-
27
-
28
-
29
-
30
-
31
-
32
-
33
-
 34
34 -
 35
35 -
 36
36 -
 37
37 -
 38
38 -
 39
39 -
 40
40 -
 41
41 -
 42
42 -
 43
43 -
 44
44 -
 45
45 -
 46
46 -
 47
47 -
 48
48 -
 49
49 -
 50
50 -
 51
51 -
 52
52 -
 53
53 -
 54
54 -
55
-
56
-
57
-
58
-
59
-
60
-
61
-
62
-
63
-
64
-
65
-
66
-
67
-
68
-
69
-
70
-
71
-
72
-
73
-
74
-
75
-
76
-
77
-
78
-
79
-
80
-
81
-
82
-
83
-
84
-
85
-
86
-
87
-
88
-
89
-
90
-
91
-
92
-
93
-
94
-
95
-
96
-
97
-
98
-
99
-
100
-
101
-
102
-
103
-
104
-
105
-
106
-
107
-
108
-
109
-
110
-
111
-
112
-
113
-
114
-
115
-
116
-
117
-
118
-
119
-
120
-
121
-
122
-
123
-
124
-
125
-
126
-
127
-
128
-
129
-
130
-
131
-
132
-
133
-
134
-
135
-
136
-
137
-
138
-
139
-
140
 |
 |

42
Management Discussion
International Business Machines Corporation and Subsidiary Companies
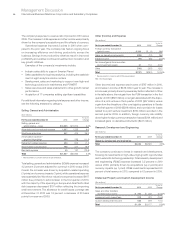
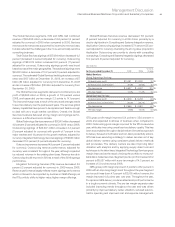
Software revenue of $21,396 million decreased 3.1 percent (1 percent
adjusted for currency) in 2009 compared to 2008. Adjusted for
currency, growth in the Key Branded Middleware products was
offset by decreased revenue in other components of the software
portfolio. Overall, the software business continued to perform well
in the uncertain environment. The company’s acquisitions increased
revenue and the company is continuing to invest in capabilities
that accelerate the development of new market opportunities like
business analytics and smarter planet.
Key Branded Middleware revenue increased 1.1 percent
(3 percent adjusted for currency) and represented 59 percent of
total Software revenue, an increase of 2 points from 2008. The
company continued to solidify its lead in the middleware market,
gaining share for nine consecutive quarters. Organic investments
and acquisitions in middleware capabilities continue to result in it
becoming a larger portion of the software portfolio and improving
the overall software revenue growth rate. Growth in 2009, adjusted
for currency, was led by WebSphere and Tivoli.
WebSphere revenue increased 10.5 percent (13 percent
adjusted for currency) in 2009 with strong performance through-
out the year. Application Servers, which provide customers with
a secure and resilient infrastructure for mission-critical business
applications, grew 5 percent adjusted for currency. Business
Integration software had double-digit revenue growth in 2009,
including strong contribution from ILOG, a company acquired
in the fourth quarter of 2008.
Information Management revenue decreased 0.5 percent
(increased 2 percent adjusted for currency) in 2009 versus the prior
year, with revenue growth, adjusted for currency, in both Information
Management solutions and infrastructure offerings. Cognos and
InfoSphere software, two key components of the business analytics
area, both had double-digit revenue growth adjusted for currency.
The acquisition of SPSS, which was completed in early October
2009, further expands the company’s business analytics capabilities.
Lotus revenue decreased 10.0 percent (8 percent adjusted for
currency) in 2009. Demand for Lotus software was impacted by
customer consolidations and downsizing throughout 2009.
Tivoli revenue increased 2.9 percent (5 percent adjusted for
currency) in 2009 when compared to 2008, driven by growth in
storage software. Tivoli storage revenue grew consistently
throughout the year as customers managed their rapidly growing
storage data.
Rational revenue increased 0.2 percent in 2009 as reported and
increased 3 percent adjusted for currency versus 2008. Rational’s
integrated software tools improve the speed, quality and efficiency
for customers with software development projects. Telelogic con-
tributed strong revenue growth in 2009 and extended the brand’s
reach into the systems development market opportunity.
Revenue from Other middleware products decreased 6.3
percent (3 percent adjusted for currency) in 2009 versus the prior
year. This software product set includes more mature products
which provide a more stable flow of revenue.
Operating systems product revenue decreased 7.4 percent
(5 percent adjusted for currency) in 2009 compared to 2008,
reflecting declining sales in all system brands.
Other revenue declined 13.9 percent (12 percent adjusted for
currency) versus 2008 primarily driven by a decrease in PLM
software.
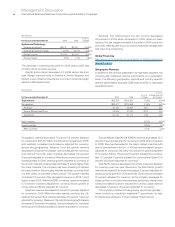
Software
($ in millions)
Yr.-to-Yr.
Yr.-to-Yr. Change Adjusted
For the year ended December 31: 2009* 2008* Change for Currency
Software external revenue: $21,396 $22,089 (3.1)% (0.8)%
Middleware $17,125 $17,305 (1.0)% 1.4%
Key Branded Middleware 12,524 12,392 1.1 3.4
WebSphere 10.5 12.7
Information Management (0.5) 1.9
Lotus (10.0) (7.9)
Tivoli 2.9 5.1
Rational 0.2 2.7
Other middleware 4,602 4,912 (6.3) (3.5)
Operating systems 2,163 2,337 (7.4) (4.9)
Other 2,108 2,448 (13.9) (12.0)
* Reclassified to conform with 2010 presentation.