IBM 2010 Annual Report Download - page 22
Download and view the complete annual report
Please find page 22 of the 2010 IBM annual report below. You can navigate through the pages in the report by either clicking on the pages listed below, or by using the keyword search tool below to find specific information within the annual report.-
 1
1 -
2
-
3
-
4
-
5
-
6
-
7
-
8
-
9
-
10
-
11
-
 12
12 -
 13
13 -
 14
14 -
 15
15 -
 16
16 -
 17
17 -
 18
18 -
 19
19 -
 20
20 -
 21
21 -
 22
22 -
 23
23 -
 24
24 -
 25
25 -
 26
26 -
 27
27 -
 28
28 -
 29
29 -
 30
30 -
 31
31 -
 32
32 -
33
-
34
-
35
-
36
-
37
-
38
-
39
-
40
-
41
-
42
-
43
-
44
-
45
-
46
-
47
-
48
-
49
-
50
-
51
-
52
-
53
-
54
-
55
-
56
-
57
-
58
-
59
-
60
-
61
-
62
-
63
-
64
-
65
-
66
-
67
-
68
-
69
-
70
-
71
-
72
-
73
-
74
-
75
-
76
-
77
-
78
-
79
-
80
-
81
-
82
-
83
-
84
-
85
-
86
-
87
-
88
-
89
-
90
-
91
-
92
-
93
-
94
-
95
-
96
-
97
-
98
-
99
-
100
-
101
-
102
-
103
-
104
-
105
-
106
-
107
-
108
-
109
-
110
-
111
-
112
-
113
-
114
-
115
-
116
-
117
-
118
-
119
-
120
-
121
-
122
-
123
-
124
-
125
-
126
-
127
-
128
-
129
-
130
-
131
-
132
-
133
-
134
-
135
-
136
-
137
-
138
-
139
-
140
 |
 |

20
Management Discussion
International Business Machines Corporation and Subsidiary Companies
share of $11.52 increased $1.51 from the prior year driven by the
following factors:
• Revenue increase at actual rates, $0.43
• Operating leverage, $0.62
• Common stock repurchases, $0.46
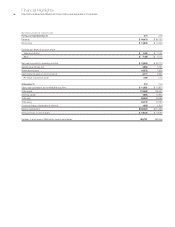
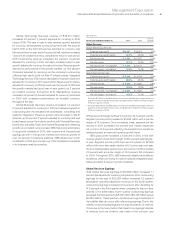
At December 31, 2010, the company’s balance sheet and liquidity
positions remained strong. Cash and marketable securities at year
end were $11,651 million. Total debt of $28,624 million increased
$2,525 million year to year, and the company generated $19,549
million in operating cash flow in 2010. The company has consistently
generated strong cash flow from operations and also continues to
have access to additional sources of liquidity through the capital
markets and its global credit facility.
Key drivers in the company’s balance sheet and total cash
flows are highlighted below.
Total assets increased $4,430 million ($3,609 million adjusted
for currency) from December 31, 2009, driven by:
• Increased goodwill ($4,946 million) and intangible assets ($975
million) driven by 2010 acquisitions;
• Higher level of total receivables ($1,337 million) and increased
total other assets ($679 million), partially offset by;
• Decreases in cash and cash equivalents ($1,522 million) and
marketable securities ($800 million); and
• Lower total deferred taxes ($1,140 million).
Total liabilities increased $4,012 million ($3,673 million adjusted for
currency) from December 31, 2009 driven by:
• Higher total debt ($2,525 million);
• Increase in deferred income ($839 million); and an
• Increase in compensation and benefits ($523 million).
Total equity of $23,172 million increased $418 million from the prior
year-end balance as a result of:
• Higher retained earnings ($11,632 million);
• Increase in common stock ($3,608 million);
• Increase in foreign currency translation adjustments ($643
million); and an
•
Increase in net unrealized gains on hedge of cash flow derivatives
($385 million), partially offset by an;
• Increase in treasury stock ($14,918 million); and a
• Decrease in retirement-related items ($992 million).
The company generated $19,549 million in cash flow provided by
operating activities, a decrease of $1,224 million, compared to 2009,
primarily driven by a decrease in cash from total receivables ($2,620
million), partially offset by the increase in net income ($1,408 million).
Net cash used in investing activities of $8,507 million was $1,778
million higher than 2009, primarily due to increased acquisitions
($4,728 million), decreased cash from divestitures ($345 million)
and increased net capital spending ($299 million), partially offset
by the year-to-year net impacts related to marketable securities
and other investments ($3,753 million).
Net cash used in financing activities of $12,429 million was
$2,271 million lower versus 2009, primarily due to the net benefit
from debt ($9,812 million) and an increase in cash from other
common stock transactions ($722 million), partially offset by higher
common stock repurchases ($7,946 million).
The estimated Global Services backlog was $142 billion at
December 31, 2010, up $5 billion ($4 billion adjusted for currency)
versus the prior year-end balance.
In January 2011, the company disclosed that it is expecting GAAP
earnings of at least $12.56 and operating (non-GAAP) earnings of
at least $13.00 per diluted share for the full year 2011. For additional
information on the company’s use of operating (non-GAAP) earnings,
see the “Looking Forward” section on pages 46 and 47.
For additional information and details, see the “Year in Review”
section on pages 25 to 39.
Description of Business
Please refer to IBM’s Annual Report on Form 10-K filed with the SEC
on February 22, 2011 for a more detailed version of this Des cription
of Business, especially Item 1A. entitled “Risk Factors.”
The company creates business value for clients and solves
business problems through integrated solutions that leverage
information technology and deep knowledge of business processes.
IBM solutions typically create value by reducing a client’s operational
costs or by enabling new capabilities that generate revenue. These
solutions draw from an industry-leading portfolio of consulting,
delivery and implementation services, enterprise software, systems
and financing.
Strategy
Despite the volatility of the information technology (IT) industry
over the past decade, IBM has consistently delivered superior
performance, with a steady track record of sustained earnings per
share growth. The company has shifted its business mix, exiting
commoditized segments while increasing its presence in higher-
value areas such as services, software and integrated solutions.
As part of this shift, the company has acquired 116 companies
this past decade, complementing and scaling its portfolio of
products and offerings.
IBM’s clear strategy has enabled steady results in core business
areas, while expanding its offerings and addressable markets. The
key tenets of this strategy are:
• Deliver value to enterprise clients through integrated business
and IT innovation;
• Shift the business mix to higher-value areas; and
• Become the premier globally integrated enterprise
These priorities reflect a broad shift in client spending away from
“point products’’ and toward integrated solutions, as companies
seek higher levels of business value from their IT investments. IBM
has been able to deliver this enhanced client value thanks to its
industry expertise, understanding of clients’ businesses and the
breadth and depth of the company’s capabilities.