IBM 2010 Annual Report Download - page 41
Download and view the complete annual report
Please find page 41 of the 2010 IBM annual report below. You can navigate through the pages in the report by either clicking on the pages listed below, or by using the keyword search tool below to find specific information within the annual report.-
 1
1 -
2
-
3
-
4
-
5
-
6
-
7
-
8
-
9
-
10
-
11
-
12
-
13
-
14
-
15
-
16
-
17
-
18
-
19
-
20
-
21
-
22
-
23
-
24
-
25
-
26
-
27
-
28
-
29
-
30
-
 31
31 -
 32
32 -
 33
33 -
 34
34 -
 35
35 -
 36
36 -
 37
37 -
 38
38 -
 39
39 -
 40
40 -
 41
41 -
 42
42 -
 43
43 -
 44
44 -
 45
45 -
 46
46 -
 47
47 -
 48
48 -
 49
49 -
 50
50 -
 51
51 -
52
-
53
-
54
-
55
-
56
-
57
-
58
-
59
-
60
-
61
-
62
-
63
-
64
-
65
-
66
-
67
-
68
-
69
-
70
-
71
-
72
-
73
-
74
-
75
-
76
-
77
-
78
-
79
-
80
-
81
-
82
-
83
-
84
-
85
-
86
-
87
-
88
-
89
-
90
-
91
-
92
-
93
-
94
-
95
-
96
-
97
-
98
-
99
-
100
-
101
-
102
-
103
-
104
-
105
-
106
-
107
-
108
-
109
-
110
-
111
-
112
-
113
-
114
-
115
-
116
-
117
-
118
-
119
-
120
-
121
-
122
-
123
-
124
-
125
-
126
-
127
-
128
-
129
-
130
-
131
-
132
-
133
-
134
-
135
-
136
-
137
-
138
-
139
-
140
 |
 |
39
Management Discussion
International Business Machines Corporation and Subsidiary Companies
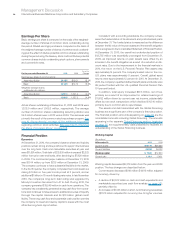
Expense
Total expense and other income increased 7.5 percent year to
year with an expense-to-revenue ratio of 25.1 percent compared
to 24.8 percent in the fourth quarter of 2009. The increase in total
expense and other income was primarily driven by the company’s
acquisitions over the past 12 months, a higher level of expense in
support of fourth-quarter revenue performance and investment
in capacity to support future growth. Within SG&A expense, work-
force rebalancing charges decreased approximately $60 million
compared to a relatively high level of activity in the fourth quarter
of 2009. With the year-to-year change in currencies, the hedge
of cash flow program generated a loss of approximately $40 million
in the fourth quarter of 2010 compared with a loss of over $250
million in the fourth quarter of 2009.
The company’s effective tax rate in the fourth quarter of 2010
was 24.4 percent compared with 24.6 percent in the fourth quarter
of 2009.
Share repurchases totaled $3,592 million in the fourth quarter.
The weighted-average number of diluted common shares out-
standing in the fourth quarter of 2010 was 1,258.4 million compared
with 1,340.7 million in the fourth quarter of 2009.
Cash Flow
The company ended the fourth quarter of 2010 with $10,661 million
in cash and cash equivalents, an increase of $801 million from
September 30, 2010. The company generated $6,795 million in
cash flow provided by operating activities, an increase of $347
million compared to the fourth quarter of 2009, driven primarily by
working capital/other ($978 million) and an increase in net income
($445 million), partially offset by Global Financing receivables
($1,060 million). Net cash used in investing activities of $4,082
million increased $1,587 million primarily due to increased acquisi-
tions of $1,859 million. Net cash used in financing activities of
$1,859 million increased $653 million due to higher payments to
repurchase common stock ($538 million), lower cash from other
common stock transactions ($401 million) and increased dividend
payments ($81 million), partially offset by an increased net benefit
associated with debt ($367 million).
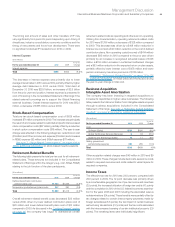
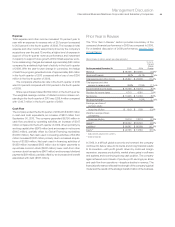
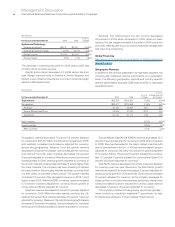
Prior Year in Review
The “Prior Year in Review” section provides a summary of the
company’s financial performance in 2009 as compared to 2008.
For a detailed discussion of 2009 performance, see the 2009
Annual Report.
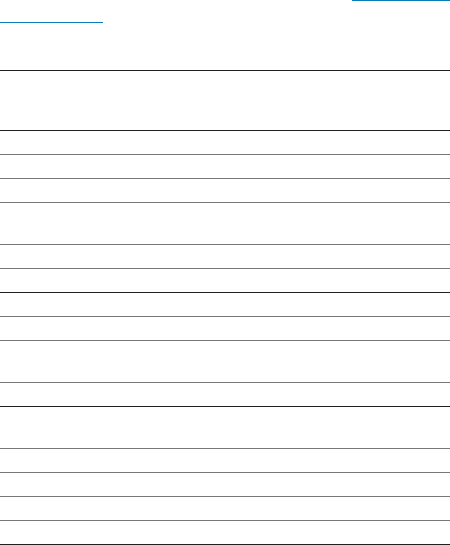
($ and shares in millions except per share amounts)
Yr.-to-Yr.
Percent/
Margin
For the year ended December 31: 2009 2008 Change
Revenue $ 95,758 $103,630 (7.6)%*
Gross profit margin 45.7% 44.1% 1.7 pts.
Total expense and other income $ 25,647 $ 28,945 (11.4)%
Total expense and other
income-to-revenue ratio 26.8% 27.9% (1.1) pts.
Income before income taxes $ 18,138 $ 16,715 8.5%
Provision for income taxes 4,713 4,381 7.6%
Net income $ 13,425 $ 12,334 8.8%
Net income margin 14.0% 11.9% 2.1 pts.
Earnings per share of
common stock:
Assuming dilution $ 10.01 $ 8.89 12.6%
Weighted-average shares
outstanding:
Assuming dilution 1,341.4 1,387.8 (3.3)%
Assets** $109,022 $109,524 (0.5)%
Liabilities** $ 86,267 $ 95,939 (10.1)%
Equity** $ 22,755 $ 13,584 67.5%
* (5.3) percent adjusted for currency.
** At December 31.
In 2009, in a difficult global economic environment, the company
continued to deliver value to its clients and strong financial results
to its investors—with profit growth driven by continued margin
expansion, expense productivity, market share gains in software
and systems and a continuing strong cash position. The company
again achieved record levels of pre-tax profit, earnings per share
and cash flow from operations—despite a decline in revenue. The
financial performance reflected the strength of the company’s global
model and the results of the strategic transformation of the business.