IBM 2010 Annual Report Download - page 49
Download and view the complete annual report
Please find page 49 of the 2010 IBM annual report below. You can navigate through the pages in the report by either clicking on the pages listed below, or by using the keyword search tool below to find specific information within the annual report.-
 1
1 -
2
-
3
-
4
-
5
-
6
-
7
-
8
-
9
-
10
-
11
-
12
-
13
-
14
-
15
-
16
-
17
-
18
-
19
-
20
-
21
-
22
-
23
-
24
-
25
-
26
-
27
-
28
-
29
-
30
-
31
-
32
-
33
-
34
-
35
-
36
-
37
-
38
-
 39
39 -
 40
40 -
 41
41 -
 42
42 -
 43
43 -
 44
44 -
 45
45 -
 46
46 -
 47
47 -
 48
48 -
 49
49 -
 50
50 -
 51
51 -
 52
52 -
 53
53 -
 54
54 -
 55
55 -
 56
56 -
 57
57 -
 58
58 -
 59
59 -
60
-
61
-
62
-
63
-
64
-
65
-
66
-
67
-
68
-
69
-
70
-
71
-
72
-
73
-
74
-
75
-
76
-
77
-
78
-
79
-
80
-
81
-
82
-
83
-
84
-
85
-
86
-
87
-
88
-
89
-
90
-
91
-
92
-
93
-
94
-
95
-
96
-
97
-
98
-
99
-
100
-
101
-
102
-
103
-
104
-
105
-
106
-
107
-
108
-
109
-
110
-
111
-
112
-
113
-
114
-
115
-
116
-
117
-
118
-
119
-
120
-
121
-
122
-
123
-
124
-
125
-
126
-
127
-
128
-
129
-
130
-
131
-
132
-
133
-
134
-
135
-
136
-
137
-
138
-
139
-
140
 |
 |

47
Management Discussion
International Business Machines Corporation and Subsidiary Companies
to its shareholders, with approximately $50 billion of share repur-
chase and $20 billion of dividends during the Road Map period.
Overall, the company expects fairly balanced contribution from
revenue growth, operating leverage and share repurchase. Similar
to its performance in the 2010 Road Map, the company is relying
on the resilience of its business model to drive the overall objective
of at least $20 of operating (non-GAAP) earnings per diluted share
in 2015. The company measures the success of its business model
over the long term, not any individual quarter or year. The com-
pany’s strategies, investments and actions are all taken with an
objective of optimizing long-term performance.
For 2010, the company’s non-GAAP operating earnings per
diluted share was $11.67. From its reported earnings per diluted
share of $11.52, operating earnings excludes acquisition-related
charges of $0.34 per share and non-operating retirement-related
costs which was income of $0.20 per share. The 2010 operating
earnings per diluted share of $11.67 is the company’s starting point
for its 2015 Road Map. The company will focus on operating earn-
ings going forward with management decisions, performance-
based compensation and business segment performance sup-
porting and tied to operating performance.
In January 2011, the company disclosed that it is expecting
GAAP earnings of at least $12.56 and operating (non-GAAP)
earnings of at least $13.00 per diluted share for the full year 2011.
The operating (non-GAAP) earnings per share expectations
excludes acquisition-related charges of $0.41 per share and non-
operating retirement-related costs of $0.03 per share. This expec-
tation results in an increase year to year of 9 percent in GAAP
earnings per share and an increase of 11 percent year to year
in operating earnings per share. The company believes the
11 percent growth in operating earnings puts the company on
track to achieve its objective of at least $20 of operating earnings
per share in 2015.
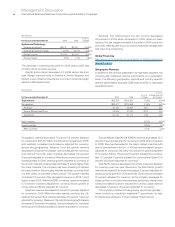
From a segment perspective, the company enters 2011
with an excellent product lineup in the Systems and Technology
business, strong momentum in the Software business and good
growth in the Global Services backlog. Within Systems and
Technology, the new System z mainframe product had a great
launch in the second half of 2010 and the company anticipates
continued opportunity and momentum for its hardware brands
in the first quarter of 2011, resulting in an expected double-digit
revenue growth rate at constant currency compared to the first
quarter of 2010. The Software business also had strong perfor-
mance in the fourth quarter. The Software business is benefiting
from the company’s strategic initiatives—business analytics,
smarter planet, growth markets and cloud—and the company
expects this to continue in the first quarter with the Software
business again delivering double-digit revenue growth at constant
currency, excluding the divested PLM operations. The Global
Services backlog, adjusted for currency, increased $4 billion from
year-end 2009 and $7 billion from the third quarter of 2010. As a
result, the company expects the Global Services revenue growth
rate in the first quarter of 2011 to improve when compared to the
fourth quarter of 2010.
In addition, in January 2011, the company disclosed that it
expected to recognize a gain on an asset sale in the first quarter of
2011. The company indicated that this gain would be primarily offset
in the first quarter by workforce rebalancing actions, predominately
in Europe, although the company expects workforce rebalancing
charges to decline in total in 2011 versus 2010. In February 2011, the
company completed the majority of the asset sale and will record a
pre-tax gain of approximately $175 million in the first quarter of 2011.
The company expects 2011 pre-tax retirement-related plan cost
to be approximately $1.9 billion, an increase of approximately $500
million compared to 2010. This estimate reflects current pension plan
assumptions at December 31, 2010. Within total retirement-related
plan cost, operating retirement-related plan cost is expected to be
approximately $1.9 billion, an increase of approximately $100 million
versus 2010. Non-operating retirement-related plan cost is expected
to be approximately zero versus income of $0.4 billion in 2010.
Effective January 1, 2011, the company will implement new
accounting standards that have been issued by the Financial
Accounting Standards Board. These standards include: amended
guidance regarding pro-forma financial information related to busi-
ness combinations, amended guidance related to goodwill impair-
ment testing, additional disclosures related to financing receivables
and additional disclosures related to fair value measurements. The
company has evaluated the new guidance and does not expect
an impact in the Consolidated Financial Statements.
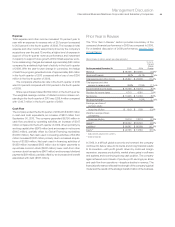
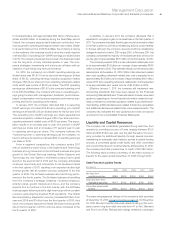
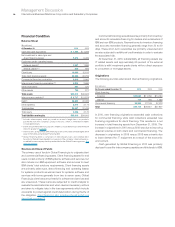
Liquidity and Capital Resources
The company has consistently generated strong cash flow from
operations, providing a source of funds ranging between $15.0
billion and $20.8 billion per year over the past five years. The com-
pany provides for additional liquidity through several sources:
maintaining an adequate cash balance, access to global funding
sources, a committed global credit facility and other committed
and uncommitted lines of credit worldwide. At December 31, 2010,
the company had total unused lines of credit of $21,388 million.
The following table provides a summary of the major sources of
liquidity for the years ended December 31, 2006 through 2010.
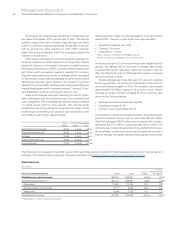
Cash Flow and Liquidity Trends
($ in billions)
2010 2009 2008 2007 2006
Net cash from
operating activities $19.5 $20.8 $18.8 $16.1 $15.0
Cash and short-term
marketable securities $11.7 $14.0 $12.9 $16.1 $10.7
Committed global credit
facilities $10.0 $10.0 $10.0 $10.0 $10.0
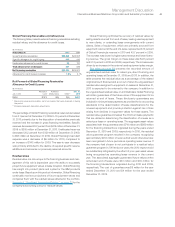
The major rating agencies’ ratings on the company’s debt securities
at December 31, 2010 appear in the table on page 48. On November
23, 2010, Moody’s Investors Services raised its rating on the com-
pany’s senior long-term debt one level from A1 to Aa3. Standard
and Poor’s and Fitch Ratings debt ratings remained unchanged