IBM 2010 Annual Report Download - page 110
Download and view the complete annual report
Please find page 110 of the 2010 IBM annual report below. You can navigate through the pages in the report by either clicking on the pages listed below, or by using the keyword search tool below to find specific information within the annual report.-
 1
1 -
2
-
3
-
4
-
5
-
6
-
7
-
8
-
9
-
10
-
11
-
12
-
13
-
14
-
15
-
16
-
17
-
18
-
19
-
20
-
21
-
22
-
23
-
24
-
25
-
26
-
27
-
28
-
29
-
30
-
31
-
32
-
33
-
34
-
35
-
36
-
37
-
38
-
39
-
40
-
41
-
42
-
43
-
44
-
45
-
46
-
47
-
48
-
49
-
50
-
51
-
52
-
53
-
54
-
55
-
56
-
57
-
58
-
59
-
60
-
61
-
62
-
63
-
64
-
65
-
66
-
67
-
68
-
69
-
70
-
71
-
72
-
73
-
74
-
75
-
76
-
77
-
78
-
79
-
80
-
81
-
82
-
83
-
84
-
85
-
86
-
87
-
88
-
89
-
90
-
91
-
92
-
93
-
94
-
95
-
96
-
97
-
98
-
99
-
 100
100 -
 101
101 -
 102
102 -
 103
103 -
 104
104 -
 105
105 -
 106
106 -
 107
107 -
 108
108 -
 109
109 -
 110
110 -
 111
111 -
 112
112 -
 113
113 -
 114
114 -
 115
115 -
 116
116 -
 117
117 -
 118
118 -
 119
119 -
 120
120 -
121
-
122
-
123
-
124
-
125
-
126
-
127
-
128
-
129
-
130
-
131
-
132
-
133
-
134
-
135
-
136
-
137
-
138
-
139
-
140
 |
 |

Notes to Consolidated Financial Statements
International Business Machines Corporation and Subsidiary Companies108
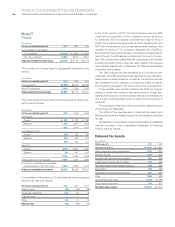
During the fourth quarter of 2008, the IRS concluded its exam-
ination of the company’s income tax returns for 2004 and 2005
and issued a final RAR. The company has agreed with all of the
adjustments contained in the RAR, with the exception of a proposed
adjustment, with a pre-tax amount in excess of $2 billion, relating
to valuation matters associated with the intercompany transfer of
certain IP in 2005 and computational issues related to certain tax
credits. The company disagrees with the IRS position on these spe-
cific matters, and in March 2009 filed a protest with the IRS Appeals
Office. No final determination has been reached on these matters.
It is expected that the audit of the company’s 2008 and 2009
U.S. income tax returns will commence in the first quarter of 2011.
The company has not provided deferred taxes on $31.1 billion
of undistributed earnings of non-U.S. subsidiaries at December
31, 2010, as it is the company’s policy to indefinitely reinvest these
earnings in non-U.S. operations. However, the company periodically
repatriates a portion of these earnings to the extent that it does
not incur an additional U.S. tax liability. Quantification of the deferred
tax liability, if any, associated with indefinitely reinvested earnings
is not practicable.
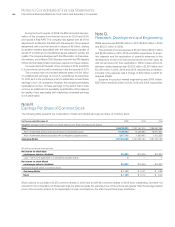
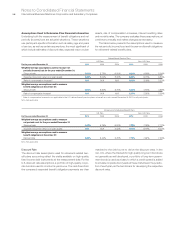
Note R.
Earnings Per Share of Common Stock
The following table presents the computation of basic and diluted earnings per share of common stock.
For the year ended December 31: 2010 2009 2008
Weighted-average number of shares on which earnings per share calculations are based:
Basic: 1,268,789,202 1,327,157,410 1,369,367,069
Add — incremental shares under stock-based compensation plans 16,189,053 12,258,864 16,617,801
Add — incremental shares associated with contingently issuable shares 2,377,133 1,936,480 1,812,328
Assuming dilution 1,287,355,388 1,341,352,754 1,387,797,198
($ in millions except per share amounts)
Net income on which basic
earnings per share is calculated $14,833 $13,425 $12,334
Less — net income applicable to contingently issuable shares 0 — 1
Net income on which diluted
earnings per share is calculated $14,833 $13,425 $12,333
Earnings/(loss) per share of common stock:
Assuming dilution $ 11.52 $ 10.01 $ 8.89
Basic $ 11.69 $ 10.12 $ 9.02
Stock options to purchase 612,272 common shares in 2009 and 42,981,463 common shares in 2008 were outstanding, but were not
included in the computation of diluted earnings per share because the exercise price of the options was greater than the average market
price of the common shares for the applicable full year, and therefore, the effect would have been antidilutive.
Note Q.
Research, Development and Engineering
RD&E expense was $6,026 million in 2010, $5,820 million in 2009
and $6,337 million in 2008.
The company incurred expense of $5,720 million, $5,523 million
and $6,015 million in 2010, 2009 and 2008, respectively, for scien-
tific research and the application of scientific advances to the
development of new and improved products and their uses, as
well as services and their application. Within these amounts,
software-related expense was $3,028 million, $2,991 million and
$3,359 million in 2010, 2009 and 2008, respectively. In addition,
included in the expense was a charge of $24 million in 2008 for
acquired IPR&D.
Expense for product-related engineering was $306 million,
$297 million and $322 million in 2010, 2009 and 2008, respectively.