IBM 2010 Annual Report Download - page 34
Download and view the complete annual report
Please find page 34 of the 2010 IBM annual report below. You can navigate through the pages in the report by either clicking on the pages listed below, or by using the keyword search tool below to find specific information within the annual report.-
 1
1 -
2
-
3
-
4
-
5
-
6
-
7
-
8
-
9
-
10
-
11
-
12
-
13
-
14
-
15
-
16
-
17
-
18
-
19
-
20
-
21
-
22
-
23
-
 24
24 -
 25
25 -
 26
26 -
 27
27 -
 28
28 -
 29
29 -
 30
30 -
 31
31 -
 32
32 -
 33
33 -
 34
34 -
 35
35 -
 36
36 -
 37
37 -
 38
38 -
 39
39 -
 40
40 -
 41
41 -
 42
42 -
 43
43 -
 44
44 -
45
-
46
-
47
-
48
-
49
-
50
-
51
-
52
-
53
-
54
-
55
-
56
-
57
-
58
-
59
-
60
-
61
-
62
-
63
-
64
-
65
-
66
-
67
-
68
-
69
-
70
-
71
-
72
-
73
-
74
-
75
-
76
-
77
-
78
-
79
-
80
-
81
-
82
-
83
-
84
-
85
-
86
-
87
-
88
-
89
-
90
-
91
-
92
-
93
-
94
-
95
-
96
-
97
-
98
-
99
-
100
-
101
-
102
-
103
-
104
-
105
-
106
-
107
-
108
-
109
-
110
-
111
-
112
-
113
-
114
-
115
-
116
-
117
-
118
-
119
-
120
-
121
-
122
-
123
-
124
-
125
-
126
-
127
-
128
-
129
-
130
-
131
-
132
-
133
-
134
-
135
-
136
-
137
-
138
-
139
-
140
 |
 |

32
Management Discussion
International Business Machines Corporation and Subsidiary Companies
The company’s expense-to-revenue ratio improved in 2010 versus
2009. The increase in total expense and other income was primarily
driven by the company’s acquisitions and the effects of currency.
Operational expense improved 2 points in 2010 when com-
pared to the prior year. The company has had an ongoing focus
on increasing efficiency and driving productivity across the
business. Savings from productivity initiatives result in improved
profitability and enables continued investments in innovation and
key growth initiatives.
Examples of the company’s investments include:
• Industry sales skills to support Smarter Planet
•
Sales capabilities for business analytics, including the establish-
ment of eight analytics solution centers
• Development, sales and marketing to support new high-end
technology solutions in mainframes and POWER7
•
Sales resources and sales enablement to drive growth market
performance
• Acquisition of 17 companies adding significant capabilities
For additional information regarding total expense and other income,
see the following analyses by category.
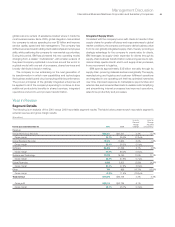
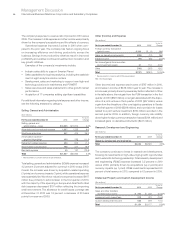
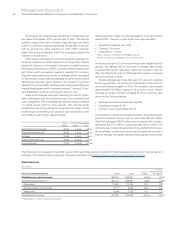
Selling, General and Administrative
($ in millions)
Yr.-to-Yr.
For the year ended December 31: 2010 2009* Change
Selling, general and
administrative — base $18,585 $17,872 4.0%
Advertising and promotional expense 1,337 1,255 6.6
Work force reductions 641 474 35.3
Amor tization expense —
acquired intangibles 253 285 (11.3)
Retirement-related expense 494 503 (1.7)
Stock-based compensation 488 417 16.9
Bad debt expense 40 147 (72.5)
Tot a l $21,837 $20,952 4.2%
* Reclassified to conform with 2010 presentation.
Total selling, general and administrative (SG&A) expense increased
4.2 percent (3 percent adjusted for currency) in 2010 versus 2009.
Overall, the increase was driven by acquisition-related spending
(3 points) and currency impacts (1 point), while operational expense
was essentially flat. Workforce reductions expense increased $167
million due primarily to actions taken in the first quarter of 2010,
with the majority of the spending in Europe and Asia Pacific. Bad
debt expense decreased $107 million reflecting the improving
credit environment. The allowance for credit losses coverage rate
at December 31, 2010 was 1.8 percent, a decrease of 20 basis
points from year-end 2009.
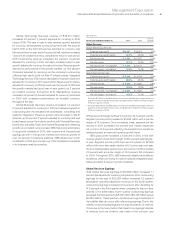
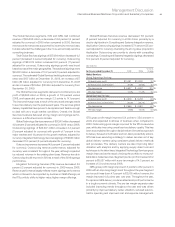
Other (Income) and Expense
($ in millions)
Yr.-to-Yr.
For the year ended December 31: 2010 2009* Change
Foreign currency transaction
(gains)/losses $ 303 $ (1) NM
Gains on derivative instruments (239) (12) NM
Interest income (92) (94) (2.3)%
Net losses/(gains) from securities
and investment assets 31 112 (72.1)
Other (790) (357) 121.2
Tot a l $(787) $(351) 124.5%
* Reclassified to conform with 2010 presentation.
NM—Not meaningful
Other (income) and expense was income of $787 million in 2010,
an increase in income of $436 million year to year. The increase in
income was primarily driven by several key factors reflected in Other
in the table above: the net gain from the PLM transaction in the first
quarter of 2010 ($591 million); a net gain associated with the dispo-
sition of a joint venture in third quarter of 2010 ($57 million) versus
a gain from the divestiture of the core logistics operations to Geodis
in the first quarter of 2009 ($298 million); and a provision for losses
related to a joint venture investment ($119 million) recorded in the
second quarter 2009. In addition, foreign currency rate volatility
drove higher foreign currency transaction losses ($304 million) and
increased gains on derivative instruments ($227 million).
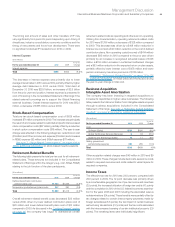
Research, Development and Engineering
($ in millions)
Yr.-to-Yr.
For the year ended December 31: 2010 2009 Change
Research, development and engineering
Tot a l $6,026 $5,820 3.5%
The company continues to invest in research and development,
focusing its investments on high-value, high-growth opportunities
and to extend its technology leadership. Total research, development
and engineering (RD&E) expense increased 3.5 percent in 2010
versus 2009, primarily driven by acquisitions (up 2 points) and
currency impacts (up 1 point). RD&E investments represented 6.0
percent of total revenue in 2010, compared to 6.1 percent in 2009.
Intellectual Property and Custom Development Income
($ in millions)
Yr.-to-Yr.
For the year ended December 31: 2010 2009 Change
Sales and other transfers
of intellectual property $ 203 $ 228 (10.8)%
Licensing/royalty-based fees 312 370 (15.6)
Custom development income 638 579 10.3
Tot a l $1,154 $1,177 (1.9)%