IBM 2010 Annual Report Download - page 20
Download and view the complete annual report
Please find page 20 of the 2010 IBM annual report below. You can navigate through the pages in the report by either clicking on the pages listed below, or by using the keyword search tool below to find specific information within the annual report.-
 1
1 -
2
-
3
-
4
-
5
-
6
-
7
-
8
-
9
-
 10
10 -
 11
11 -
 12
12 -
 13
13 -
 14
14 -
 15
15 -
 16
16 -
 17
17 -
 18
18 -
 19
19 -
 20
20 -
 21
21 -
 22
22 -
 23
23 -
 24
24 -
 25
25 -
 26
26 -
 27
27 -
 28
28 -
 29
29 -
 30
30 -
31
-
32
-
33
-
34
-
35
-
36
-
37
-
38
-
39
-
40
-
41
-
42
-
43
-
44
-
45
-
46
-
47
-
48
-
49
-
50
-
51
-
52
-
53
-
54
-
55
-
56
-
57
-
58
-
59
-
60
-
61
-
62
-
63
-
64
-
65
-
66
-
67
-
68
-
69
-
70
-
71
-
72
-
73
-
74
-
75
-
76
-
77
-
78
-
79
-
80
-
81
-
82
-
83
-
84
-
85
-
86
-
87
-
88
-
89
-
90
-
91
-
92
-
93
-
94
-
95
-
96
-
97
-
98
-
99
-
100
-
101
-
102
-
103
-
104
-
105
-
106
-
107
-
108
-
109
-
110
-
111
-
112
-
113
-
114
-
115
-
116
-
117
-
118
-
119
-
120
-
121
-
122
-
123
-
124
-
125
-
126
-
127
-
128
-
129
-
130
-
131
-
132
-
133
-
134
-
135
-
136
-
137
-
138
-
139
-
140
 |
 |

18
Management Discussion
International Business Machines Corporation and Subsidiary Companies
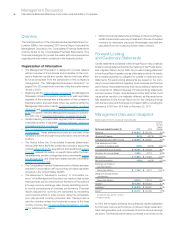
Overview
The financial section of the International Business Machines Cor-
por ation (IBM or the company) 2010 Annual Report includes the
Management Discussion, the Consolidated Financial State ments
and the Notes to the Consolidated Financial State ments. This
Over view is designed to provide the reader with some perspective
regarding the information contained in the financial section.
Organization of Information
• The Management Discussion is designed to provide readers
with an overview of the business and a narrative on the com-
pany’s financial results and certain factors that may affect
its future prospects from the perspective of the company’s
management. The “Management Discussion Snap shot” on
pages 18 to 20 presents an overview of the key performance
drivers in 2010.
•
Beginning with the “Year in Review” on page 25, the Manage ment
Discussion contains the results of operations for each reportable
segment of the business and a discussion of the company’s
financial position and cash flows. Other key sections within the
Management Discussion include: “Looking Forward” on pages
46 and 47 and “Liquidity and Capital Resources” on pages 47
to 50. It is useful to read the Management Dis cussion in conjunc-
tion with note V, “Segment Information,” on pages 126 to 130.
• Global Financing is a reportable segment that is measured as
a standalone entity. A separate “Global Financing” section is
included beginning on page 55.
• The Consolidated Financial Statements are presented on pages
62 through 67. These statements provide an overview of the
company’s income and cash flow performance and its financial
position.
• The Notes follow the Consolidated Financial Statements.
Among other items, the Notes contain the company’s accounting
policies (pages 68 to 79), acquisitions and divestitures (pages
81 to 86), detailed information on specific items within the finan-
cial statements, certain contingencies and commitments (pages
103 through 105), and retirement-related benefits information
(pages 112 through 126).
• The Consolidated Financial Statements and the Notes have been
prepared in accordance with accounting principles generally
accepted in the United States (GAAP).
• The references to “adjusted for currency” or “at constant cur-
rency” in the Management Discussion are made so that certain
financial results can be viewed without the impact of fluctuations
in foreign currency exchange rates, thereby facilitating period-
to-period comparisons of business performance. Financial
results adjusted for currency are calculated by translating
current period activity in local currency using the comparable
prior year period’s currency conversion rate. This approach is
used for countries where the functional currency is the local
country currency. See “Currency Rate Fluctuations” on page
53 for additional information.
•
Within the financial statements and tables in this Annual Report,
certain columns and rows may not add due to the use of rounded
numbers for disclosure purposes. Percentages reported are
calculated from the underlying whole-dollar numbers.
Forward-Looking
and Cautionary Statements
Certain statements contained in this Annual Report may constitute
forward-looking statements within the meaning of the Private Secur-
ities Litigation Reform Act of 1995. Any forward-looking statement
in this Annual Report speaks only as of the date on which it is made;
the company assumes no obligation to update or revise any such
statements. Forward-looking statements are based on the com-
pany’s current assumptions regarding future business and financial
performance; these statements by their nature address matters that
are uncertain to different degrees. Forward-looking statements
involve a number of risks, uncertainties and other factors that could
cause actual results to be materially different, as discussed more
fully elsewhere in this Annual Report and in the company’s filings
with the Securities and Exchange Commission (SEC), including the
company’s 2010 Form 10-K filed on February 22, 2011.
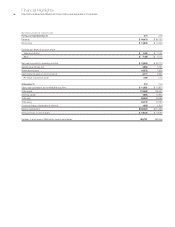
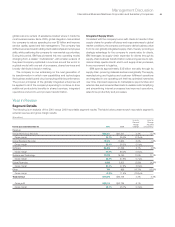
Management Discussion Snapshot
($ and shares in millions except per share amounts)
Yr.- to -Yr.
Percent/
Margin
For the year ended December 31: 2010 2009 Change
Revenue $ 99,870 $ 95,758 4.3%*
Gross profit margin 46.1% 45.7% 0.3 pts.
Total expense and other income $ 26,291 $ 25,647 2.5%
Total expense and other
income-to-revenue ratio 26.3% 26.8% (0.5) pts.
Income before income taxes $ 19,723 $ 18,138 8.7%
Provision for income taxes 4,890 4,713 3.8%
Net income $ 14,833 $ 13,425 10.5%
Net income margin 14.9% 14.0% 0.8 pts.
Earnings per share of
common stock:
Assuming dilution $ 11.52 $ 10.01 15.1%
Weighted-average shares
outstanding:
Assuming dilution 1,287.4 1,341.4 (4.0)%
Assets** $113,452 $109,022 4.1%
Liabilities** $ 90,279 $ 86,267 4.7%
Equity** $ 23,172 $ 22,755 1.8%
* 3.3 percent adjusted for currency.
** At December 31.
In 2010, the company delivered strong financial results highlighted
by improved revenue performance, continued margin expansion,
solid cash generation and record levels of net income and earnings
per share. The financial performance continues to be driven by the