IBM 2010 Annual Report Download - page 116
Download and view the complete annual report
Please find page 116 of the 2010 IBM annual report below. You can navigate through the pages in the report by either clicking on the pages listed below, or by using the keyword search tool below to find specific information within the annual report.-
 1
1 -
2
-
3
-
4
-
5
-
6
-
7
-
8
-
9
-
10
-
11
-
12
-
13
-
14
-
15
-
16
-
17
-
18
-
19
-
20
-
21
-
22
-
23
-
24
-
25
-
26
-
27
-
28
-
29
-
30
-
31
-
32
-
33
-
34
-
35
-
36
-
37
-
38
-
39
-
40
-
41
-
42
-
43
-
44
-
45
-
46
-
47
-
48
-
49
-
50
-
51
-
52
-
53
-
54
-
55
-
56
-
57
-
58
-
59
-
60
-
61
-
62
-
63
-
64
-
65
-
66
-
67
-
68
-
69
-
70
-
71
-
72
-
73
-
74
-
75
-
76
-
77
-
78
-
79
-
80
-
81
-
82
-
83
-
84
-
85
-
86
-
87
-
88
-
89
-
90
-
91
-
92
-
93
-
94
-
95
-
96
-
97
-
98
-
99
-
100
-
101
-
102
-
103
-
104
-
105
-
 106
106 -
 107
107 -
 108
108 -
 109
109 -
 110
110 -
 111
111 -
 112
112 -
 113
113 -
 114
114 -
 115
115 -
 116
116 -
 117
117 -
 118
118 -
 119
119 -
 120
120 -
 121
121 -
 122
122 -
 123
123 -
 124
124 -
 125
125 -
 126
126 -
127
-
128
-
129
-
130
-
131
-
132
-
133
-
134
-
135
-
136
-
137
-
138
-
139
-
140
 |
 |

Notes to Consolidated Financial Statements
International Business Machines Corporation and Subsidiary Companies114
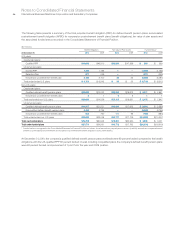
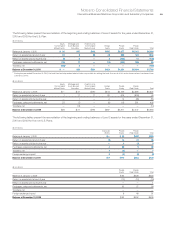
The following table presents a summary of the total projected benefit obligation (PBO) for defined benefit pension plans, accumulated
postretirement benefit obligation (APBO) for nonpension postretirement benefit plans (benefit obligations), fair value of plan assets and
the associated funded status recorded in the Consolidated Statement of Financial Position.
($ in millions)
Benefit Obligations Fair Value of Plan Assets Funded Status*
At December 31: 2010 2009 2010 2009 2010 2009
U.S. plans:
Overfunded plans:
Qualified PPP $49,663 $46,910 $50,259 $ 47,269 $ 596 $ 359
Underfunded plans:
Excess PPP 1,360 1,195 — — (1,360) (1,195)
Retention Plan 271 249 — — (271) (249)
Nonpension postretirement benefit plan 5,123 5,100 35 33 (5,088) (5,067)
Total underfunded U.S. plans $ 6,753 $ 6,545 $ 35 $ 33 $ (6,718) $ (6,512)
Non-U.S. plans:
Overfunded plans:
Qualified defined benefit pension plans $22,625 $14,032 $25,096 $16,673 $ 2,471 $ 2,641
Nonpension postretirement benefit plans 8 7 9 8 1 1
Total overfunded non-U.S. plans $22,633 $14,039 $25,105 $16,681 $ 2,472 $ 2,642
Underfunded plans:
Qualified defined benefit pension plans $14,507 $21,521 $10,626 $17,633 $ (3,881) $ (3,888)
Nonqualified defined benefit pension plans 5,452 5,755 — — (5,452) (5,755)
Nonpension postretirement benefit plans 864 760 111 96 (753) (664)
Total underfunded non-U.S. plans $20,823 $28,036 $10,737 $17,729 $(10,086) $(10,307)
Total overfunded plans $72,296 $60,949 $75,364 $63,950 $ 3,068 $ 3,001
Total underfunded plans $27,576 $34,581 $10,772 $17,762 $(16,804) $(16,819)
* Funded status is recognized in the Consolidated Statement of Financial Position as follows: Asset amounts as prepaid pension assets; (Liability) amounts as compensation and
benefits (current liability) and retirement and nonpension postretirement benefit obligations (noncurrent liability).
At December 31, 2010, the company’s qualified defined benefit pension plans worldwide were 99 percent funded compared to the benefit
obligations, with the U.S. qualified PPP 101 percent funded. Overall, including nonqualifed plans, the company’s defined benefit pension plans
were 92 percent funded, an improvement of 1 point from the year-end 2009 position.