IBM 2010 Annual Report Download - page 29
Download and view the complete annual report
Please find page 29 of the 2010 IBM annual report below. You can navigate through the pages in the report by either clicking on the pages listed below, or by using the keyword search tool below to find specific information within the annual report.-
 1
1 -
2
-
3
-
4
-
5
-
6
-
7
-
8
-
9
-
10
-
11
-
12
-
13
-
14
-
15
-
16
-
17
-
18
-
 19
19 -
 20
20 -
 21
21 -
 22
22 -
 23
23 -
 24
24 -
 25
25 -
 26
26 -
 27
27 -
 28
28 -
 29
29 -
 30
30 -
 31
31 -
 32
32 -
 33
33 -
 34
34 -
 35
35 -
 36
36 -
 37
37 -
 38
38 -
 39
39 -
40
-
41
-
42
-
43
-
44
-
45
-
46
-
47
-
48
-
49
-
50
-
51
-
52
-
53
-
54
-
55
-
56
-
57
-
58
-
59
-
60
-
61
-
62
-
63
-
64
-
65
-
66
-
67
-
68
-
69
-
70
-
71
-
72
-
73
-
74
-
75
-
76
-
77
-
78
-
79
-
80
-
81
-
82
-
83
-
84
-
85
-
86
-
87
-
88
-
89
-
90
-
91
-
92
-
93
-
94
-
95
-
96
-
97
-
98
-
99
-
100
-
101
-
102
-
103
-
104
-
105
-
106
-
107
-
108
-
109
-
110
-
111
-
112
-
113
-
114
-
115
-
116
-
117
-
118
-
119
-
120
-
121
-
122
-
123
-
124
-
125
-
126
-
127
-
128
-
129
-
130
-
131
-
132
-
133
-
134
-
135
-
136
-
137
-
138
-
139
-
140
 |
 |

27
Management Discussion
International Business Machines Corporation and Subsidiary Companies
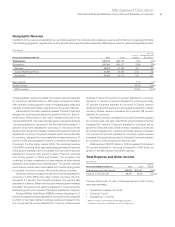
Global Technology Services revenue of $38,201 million
increased 2.3 percent (1 percent adjusted for currency) in 2010
versus 2009. The rate of year-to-year revenue growth, adjusted
for currency, demonstrated an improving trend over the second
half of 2010. In the first half, revenue, adjusted for currency, was
flat versus the prior year, and in the second half, revenue increased
1 percent, at constant currency, compared to the prior year period.
GTS Outsourcing revenue increased 2.9 percent (1 percent
adjusted for currency) in 2010 with fairly consistent year-to-year
growth, adjusted for currency, throughout the year. Revenue growth
was led by performance in the growth markets, up 18.4 percent
(8 percent adjusted for currency), as the company’s outsourcing
offerings help clients build out their IT infrastructures. Integrated
Technology Services (ITS) revenue decreased 0.6 percent (2 percent
adjusted for currency) in 2010 versus 2009. Revenue performance,
adjusted for currency, in ITS improved over the course of 2010 and
the growth markets had good year-to-year growth, up 8 percent
at constant currency, throughout 2010. Maintenance revenue
increased 4.2 percent (3 percent adjusted for currency) compared
to 2009 with consistent performance, at constant currency,
throughout the year.
Global Business Services revenue increased 3.2 percent
(2 percent adjusted for currency) in 2010 and delivered growth in
outsourcing and the transactional businesses: consulting and
systems integration. Revenue growth was strongest in North
America, up 8.5 percent (7 percent adjusted for currency) and was
broad based across the industry sectors with Financial Services,
Distribution, Industrial, Public and General Business each delivering
growth on a constant currency basis. GBS had good performance
in its growth initiatives in 2010, with revenue and transactional
signings growth in the growth markets and revenue growth of
over 35 percent in business analytics. GBS added over 4,000
consultants in 2010 and now has over 7,800 dedicated consultants
in its business analytics practice.
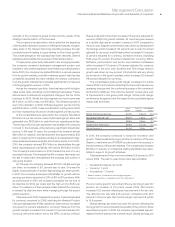
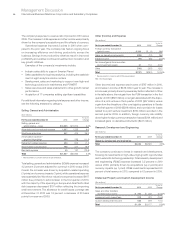
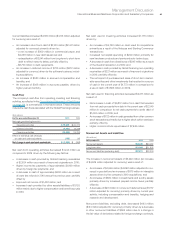
($ in millions)
Yr.- to -Yr.
For the year ended December 31: 2010 2009 Change
Global Services:
Global Technology Services:
External gross profit $13,267 $13,081 1.4%
External gross profit margin 34.7% 35.0% (0.3) pts.
Pre-tax income $ 5,568 $ 5,537 0.6%
Pre-tax margin 14.1% 14.3% (0.2) pts.
Pre-tax income—normalized* $ 5,840 $ 5,571 4.8%
Pre-tax margin—normalized 14.8% 14.4% 0.4 pts.
Global Business Services:
External gross profit $ 5,148 $ 4,979 3.4%
External gross profit margin 28.3% 28.2% 0.0 pts.
Pre-tax income $ 2,569 $ 2,555 0.5%
Pre-tax margin 13.5% 13.8% (0.3) pts.
Pre-tax income—normalized** $ 2,697 $ 2,632 2.5%
Pre-tax margin—normalized 14.2% 14.2% 0.0 pts.
* Excludes $273 million and $115 million of workforce rebalancing charges in the first
quarter of 2010 and 2009, respectively, and ($81) million related to the Geodis gain
in the first quarter of 2009.
** Excludes $128 million and $123 million of workforce rebalancing charges in the first
quarter of 2010 and 2009, respectively, and ($46) million related to the Geodis gain
in the first quarter of 2009.
GTS gross profit margin declined 0.3 points to 34.7 percent in 2010.
Segment pre-tax profit increased to $5,568 million with a pre-tax
margin of 14.1 percent. On a normalized basis, segment pre-tax
income in 2010 increased 4.8 percent and margin expanded
0.4 points to 14.8 percent reflecting the benefits from workforce
rebalancing and an improved revenue growth trend.
GBS gross profit increased 3.4 percent in 2010, in line with
revenue growth. Gross profit margin of 28.3 percent was flat year-
to-year. Segment pre-tax profit improved 0.5 percent to $2,569
million with a pre-tax margin decline of 0.3 points year over year.
On a normalized basis, segment pre-tax income in 2010 increased
2.5 percent with a pre-tax margin of 14.2 percent, flat compared
to 2009. Throughout 2010, GBS improved utilization and delivery
excellence, while continuing to invest in globally integrated capa-
bilities and skills to support growth initiatives.
Global Services Signings
Total Global Services signings of $57,696 million increased 1.1
percent (flat adjusted for currency) compared to 2009. Outsourcing
signings for the year of $33,064 million increased 0.2 percent
(decreased 1 percent adjusted for currency). In the fourth quarter,
outsourcing signings increased 24.2 percent, after declining by
14.9 percent in the third quarter when compared to the prior year
periods. On a dollar basis, fourth quarter outsourcing signings
exceeded the third quarter by $8,458 million ($14,138 million versus
$5,680 million). These quarterly dynamics are a good example of
the volatility that can occur with outsourcing signings. Due to this
volatility, outsourcing signings are not a good predictor of revenue.
This is due to the many factors that impact how signings translate
to revenue, such as duration, start date of the contract, and