IBM 2010 Annual Report Download - page 30
Download and view the complete annual report
Please find page 30 of the 2010 IBM annual report below. You can navigate through the pages in the report by either clicking on the pages listed below, or by using the keyword search tool below to find specific information within the annual report.-
 1
1 -
2
-
3
-
4
-
5
-
6
-
7
-
8
-
9
-
10
-
11
-
12
-
13
-
14
-
15
-
16
-
17
-
18
-
19
-
 20
20 -
 21
21 -
 22
22 -
 23
23 -
 24
24 -
 25
25 -
 26
26 -
 27
27 -
 28
28 -
 29
29 -
 30
30 -
 31
31 -
 32
32 -
 33
33 -
 34
34 -
 35
35 -
 36
36 -
 37
37 -
 38
38 -
 39
39 -
 40
40 -
41
-
42
-
43
-
44
-
45
-
46
-
47
-
48
-
49
-
50
-
51
-
52
-
53
-
54
-
55
-
56
-
57
-
58
-
59
-
60
-
61
-
62
-
63
-
64
-
65
-
66
-
67
-
68
-
69
-
70
-
71
-
72
-
73
-
74
-
75
-
76
-
77
-
78
-
79
-
80
-
81
-
82
-
83
-
84
-
85
-
86
-
87
-
88
-
89
-
90
-
91
-
92
-
93
-
94
-
95
-
96
-
97
-
98
-
99
-
100
-
101
-
102
-
103
-
104
-
105
-
106
-
107
-
108
-
109
-
110
-
111
-
112
-
113
-
114
-
115
-
116
-
117
-
118
-
119
-
120
-
121
-
122
-
123
-
124
-
125
-
126
-
127
-
128
-
129
-
130
-
131
-
132
-
133
-
134
-
135
-
136
-
137
-
138
-
139
-
140
 |
 |

28
Management Discussion
International Business Machines Corporation and Subsidiary Companies
whether it is a new contract or an extension of an existing contract.
The company’s outsourcing business revenue is more determined
by backlog, and period signings are just one of several inputs to
backlog. Transactional signings increased 2.3 percent (1 percent
adjusted for currency) to $24,633 million, with growth in Integrated
Technology Services and Consulting signings. In the transactional
services businesses, revenue growth and signings growth
have historically been similar within a quarterly period. Revenue
Global Services signings are management’s initial estimate of the
revenue value of a client’s commitment under a Global Services
contract. There are no third-party standards or requirements
governing the calculation of signings. The calculation used by
management involves estimates and judgments to gauge the
extent of a client’s commitment, including the type and duration of
the agreement, and the presence of termination charges or wind-
down costs.
Signings include GTS Outsourcing, ITS and GBS contracts.
Contract extensions and increases in scope are treated as signings
only to the extent of the incremental new revenue value. Maintenance
is not included in signings as maintenance contracts tend to be
more steady state, where revenues equal renewals.
Total Global Services backlog includes GTS Outsourcing, ITS,
GBS and Maintenance. Outsourcing backlog includes GTS Outsourc-
ing and Application Management Services Outsourcing. Backlog
is intended to be a statement of overall work under contract and
therefore does include Maintenance. Backlog estimates are subject
to change and are affected by several factors, including terminations,
changes in the scope of contracts, periodic revalidations, adjust-
ments for revenue not materialized and adjustments for currency.
Contract portfolios purchased in an acquisition are treated as
positive backlog adjustments provided those contracts meet the
company’s requirements for initial signings. A new signing will be
recognized if a new services agreement is signed incidental or
coincidental to an acquisition or divestiture.
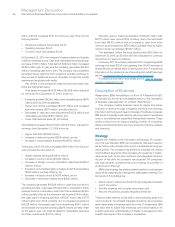
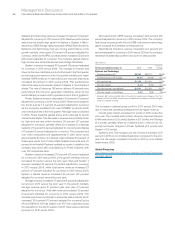
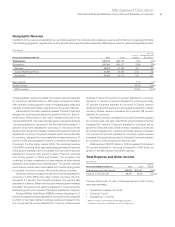
Software
($ in millions)
Yr.-to-Yr.
Yr.-to-Yr. Change Adjusted
For the year ended December 31: 2010 2009* Change for Currency
Software external revenue: $22,485 $21,396 5.1% 4.8%
Middleware $18,444 $17,125 7.7% 7.5%
Key Branded Middleware 13,876 12,524 10.8 10.7
WebSphere 20.8 20.6
Information Management 8.6 8.3
Lotus (2.3) (2.1)
Tivoli 15.0 15.1
Rational 4.8 4.8
Other middleware 4,568 4,602 (0.7) (1.2)
Operating systems 2,282 2,163 5.5 4.9
Other 1,759 2,108 (16.6) (17.0)
* Reclassified to conform with 2010 presentation.
performance is predominantly determined by the dynamics within
a quarter with signings providing little additional insight into period
performance.
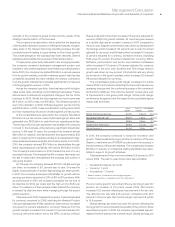
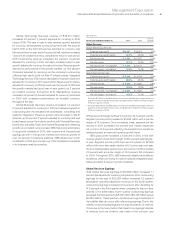
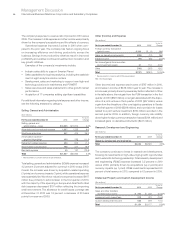
The following table presents Global Services signings.
Outsourcing signings include GTS Outsourcing and Application
Management Services Outsourcing. Transactional signings include
Integrated Technology Services, Consulting and AMS Systems
Integration.
($ in millions)
Yr.-to-Yr.
Yr.-to-Yr. Change Adjusted
For the year ended December 31: 2010 2009 Change for Currency
Outsourcing signings $33,064 $33,014 0.2% (1.0)%
Transactional signings 24,633 24,081 2.3 1.4
Total signings $57,696 $57,094 1.1% 0.0%