IBM 2010 Annual Report Download - page 27
Download and view the complete annual report
Please find page 27 of the 2010 IBM annual report below. You can navigate through the pages in the report by either clicking on the pages listed below, or by using the keyword search tool below to find specific information within the annual report.-
 1
1 -
2
-
3
-
4
-
5
-
6
-
7
-
8
-
9
-
10
-
11
-
12
-
13
-
14
-
15
-
16
-
 17
17 -
 18
18 -
 19
19 -
 20
20 -
 21
21 -
 22
22 -
 23
23 -
 24
24 -
 25
25 -
 26
26 -
 27
27 -
 28
28 -
 29
29 -
 30
30 -
 31
31 -
 32
32 -
 33
33 -
 34
34 -
 35
35 -
 36
36 -
 37
37 -
38
-
39
-
40
-
41
-
42
-
43
-
44
-
45
-
46
-
47
-
48
-
49
-
50
-
51
-
52
-
53
-
54
-
55
-
56
-
57
-
58
-
59
-
60
-
61
-
62
-
63
-
64
-
65
-
66
-
67
-
68
-
69
-
70
-
71
-
72
-
73
-
74
-
75
-
76
-
77
-
78
-
79
-
80
-
81
-
82
-
83
-
84
-
85
-
86
-
87
-
88
-
89
-
90
-
91
-
92
-
93
-
94
-
95
-
96
-
97
-
98
-
99
-
100
-
101
-
102
-
103
-
104
-
105
-
106
-
107
-
108
-
109
-
110
-
111
-
112
-
113
-
114
-
115
-
116
-
117
-
118
-
119
-
120
-
121
-
122
-
123
-
124
-
125
-
126
-
127
-
128
-
129
-
130
-
131
-
132
-
133
-
134
-
135
-
136
-
137
-
138
-
139
-
140
 |
 |

25
Management Discussion
International Business Machines Corporation and Subsidiary Companies
Year in Review
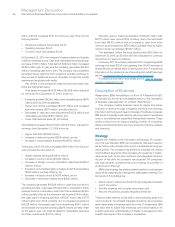
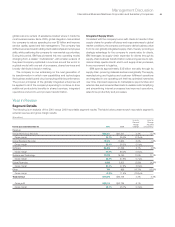
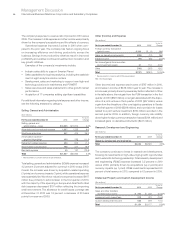
Segment Details
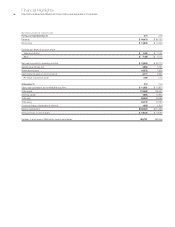
The following is an analysis of the 2010 versus 2009 reportable segment results. The table below presents each reportable segment’s
external revenue and gross margin results.
($ in millions)
Yr.-to-Yr. Yr.-to-Yr.
Percent/ Change
Margin Adjusted
For the year ended December 31: 2010 2009 Change for Currency
Revenue:
Global Technology Services $38,201 $37,347 2.3% 0.7%
Gross margin 34.7% 35.0% (0.3) pts.
Global Business Services 18,223 17,653 3.2% 1.6%
Gross margin 28.3% 28.2% 0.0 pts.
Software 22,485 21,396 5.1% 4.8%
Gross margin 86.9% 86.0% 0.9 pts.
Systems and Technology 17,973 16,190 11.0% 11.1%
Gross margin 38.5% 37.8% 0.7 pts.
Global Financing 2,238 2,302 (2.8)% (4.3)%
Gross margin 51.3% 47.5% 3.8 pts.
Other 750 869 (13.7)% (13.8)%
Gross margin (0.9)% 11.6% (12.5) pts.
Total revenue $99,870 $95,758 4.3% 3.3%
Gross profit $46,014 $43,785 5.1%
Gross margin 46.1% 45.7% 0.3 pts.
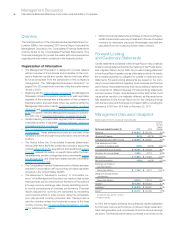
global resource centers of excellence located where it made the
most business sense. Since 2005, global integration has enabled
the company to reduce spending by over $5 billion and improve
service quality, speed and risk management. The company has
shifted resources toward building client relationships and employees
skills, while positioning the company for new market opportunities.
During this period, IBM has pioneered this new operating model,
changing from a classic “multinational”, with smaller versions of
the parent company replicated in countries around the world, to
a global model with one set of processes, shared services and
broadly distributed decision making.
The company is now embarking on the next generation of
its transformation in which new capabilities and technologies
like business analytics and cloud computing will drive performance.
The proven principles of the globally integrated enterprise will
be applied to all of the company’s spending to continue to drive
additional productivity benefits in shared services, integrated
operations and end-to-end process transformation.
Integrated Supply Chain
Consistent with the company’s work with clients to transform their
supply chains for greater efficiency and responsiveness to global
market conditions, the company continues to derive business value
from its own globally integrated supply chain, thereby providing a
strategic advantage for the company to create value for clients.
IBM leverages its supply-chain expertise for clients through its
supply-chain business transformation outsourcing service to opti-
mize and help operate clients’ end-to-end supply-chain processes,
from procurement to logistics.
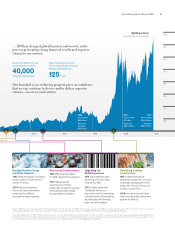
IBM spends approximately $35 billion annually through its
supply chain, procuring materials and services globally. The supply,
manufacturing, and logistics and customer fulfillment operations
are integrated in one operating unit that has optimized inventories
over time, improved response to marketplace opportunities and
external risks, and converted fixed costs to variable costs. Simplifying
and streamlining internal processes has improved operations,
sales force productivity and processes.