IBM 2010 Annual Report Download - page 117
Download and view the complete annual report
Please find page 117 of the 2010 IBM annual report below. You can navigate through the pages in the report by either clicking on the pages listed below, or by using the keyword search tool below to find specific information within the annual report.-
 1
1 -
2
-
3
-
4
-
5
-
6
-
7
-
8
-
9
-
10
-
11
-
12
-
13
-
14
-
15
-
16
-
17
-
18
-
19
-
20
-
21
-
22
-
23
-
24
-
25
-
26
-
27
-
28
-
29
-
30
-
31
-
32
-
33
-
34
-
35
-
36
-
37
-
38
-
39
-
40
-
41
-
42
-
43
-
44
-
45
-
46
-
47
-
48
-
49
-
50
-
51
-
52
-
53
-
54
-
55
-
56
-
57
-
58
-
59
-
60
-
61
-
62
-
63
-
64
-
65
-
66
-
67
-
68
-
69
-
70
-
71
-
72
-
73
-
74
-
75
-
76
-
77
-
78
-
79
-
80
-
81
-
82
-
83
-
84
-
85
-
86
-
87
-
88
-
89
-
90
-
91
-
92
-
93
-
94
-
95
-
96
-
97
-
98
-
99
-
100
-
101
-
102
-
103
-
104
-
105
-
106
-
 107
107 -
 108
108 -
 109
109 -
 110
110 -
 111
111 -
 112
112 -
 113
113 -
 114
114 -
 115
115 -
 116
116 -
 117
117 -
 118
118 -
 119
119 -
 120
120 -
 121
121 -
 122
122 -
 123
123 -
 124
124 -
 125
125 -
 126
126 -
 127
127 -
128
-
129
-
130
-
131
-
132
-
133
-
134
-
135
-
136
-
137
-
138
-
139
-
140
 |
 |

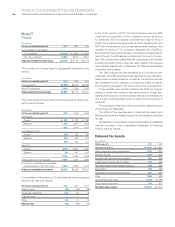
Notes to Consolidated Financial Statements
International Business Machines Corporation and Subsidiary Companies 115
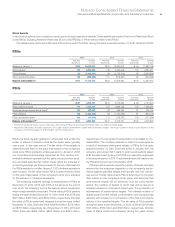
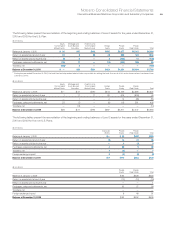
($ in millions)
Defined Benefit Pension Plans
U.S. Plans Non-U.S. Plans
For the year ended December 31: 2010 2009 2008 2010 2009 2008
Service cost $ — $ — $ — $ 508 $ 585 $ 660
Interest cost 2,601 2,682 2,756 1,841 1,898 2,042
Expected return on plan assets (4,017) (4,009) (3,978) (2,461) (2,534) (2,725)
Amortization of transition assets — — — (0) (0) (0)
Amortization of prior service costs/(credits) 10 10 (7) (174) (126) (129)
Recognized actuarial losses 471 411 291 712 624 612
Curtailments and settlements 1 — 2 27 (126) (139)
Multi-employer plan/other costs — — — 89 200 82
Total net periodic (income)/cost $ (935) $ (906) $ (936) $ 541 $ 521 $ 402
($ in millions)
Nonpension Postretirement Benefit Plans
U.S. Plan Non-U.S. Plans
For the year ended December 31: 2010 2009 2008 2010 2009 2008
Service cost $ 33 $ 41 $ 55 $ 9 $10 $ 10
Interest cost 262 289 312 59 51 53
Expected return on plan assets — — (8) (9) (8) (10)
Amortization of transition assets — — — 0 0 0
Amortization of prior service costs/(credits) (14) (39) (62) (5) (6) (7)
Recognized actuarial losses — — 9 12 11 14
Curtailments and settlements — — 3 — — (6)
Total net periodic cost $281 $292 $310 $66 $58 $ 53
Defined Benefit Pension and Nonpension
Postretirement Benefit Plan Financial Information
The following tables through page 117 represent financial information
for the company’s retirement-related benefit plans, excluding defined
contribution plans. The defined benefit pension plans within the U.S.
Plans consists of the Qualified PPP, the Excess PPP and the
Retention Plan. Defined benefit pension plans within the Non-
U.S. Plans consists of all plans sponsored by the company’s
subsidiaries. The nonpension postretirement benefit plan in the
U.S. Plan represents the U.S. Non pension Postretirement Benefit
Plan. Nonpension postretirement benefit plans within Non-U.S.
Plans consist of all plans sponsored by the company’s subsidiaries.
The tables below present the components of net periodic
(income)/cost of the company’s retirement-related benefit plans
recognized in Consoli dated Statement of Earnings, excluding
defined contribution plans.