IBM 2010 Annual Report Download - page 35
Download and view the complete annual report
Please find page 35 of the 2010 IBM annual report below. You can navigate through the pages in the report by either clicking on the pages listed below, or by using the keyword search tool below to find specific information within the annual report.-
 1
1 -
2
-
3
-
4
-
5
-
6
-
7
-
8
-
9
-
10
-
11
-
12
-
13
-
14
-
15
-
16
-
17
-
18
-
19
-
20
-
21
-
22
-
23
-
24
-
 25
25 -
 26
26 -
 27
27 -
 28
28 -
 29
29 -
 30
30 -
 31
31 -
 32
32 -
 33
33 -
 34
34 -
 35
35 -
 36
36 -
 37
37 -
 38
38 -
 39
39 -
 40
40 -
 41
41 -
 42
42 -
 43
43 -
 44
44 -
 45
45 -
46
-
47
-
48
-
49
-
50
-
51
-
52
-
53
-
54
-
55
-
56
-
57
-
58
-
59
-
60
-
61
-
62
-
63
-
64
-
65
-
66
-
67
-
68
-
69
-
70
-
71
-
72
-
73
-
74
-
75
-
76
-
77
-
78
-
79
-
80
-
81
-
82
-
83
-
84
-
85
-
86
-
87
-
88
-
89
-
90
-
91
-
92
-
93
-
94
-
95
-
96
-
97
-
98
-
99
-
100
-
101
-
102
-
103
-
104
-
105
-
106
-
107
-
108
-
109
-
110
-
111
-
112
-
113
-
114
-
115
-
116
-
117
-
118
-
119
-
120
-
121
-
122
-
123
-
124
-
125
-
126
-
127
-
128
-
129
-
130
-
131
-
132
-
133
-
134
-
135
-
136
-
137
-
138
-
139
-
140
 |
 |

33
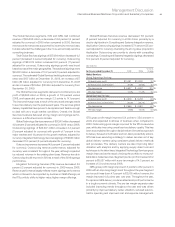
Management Discussion
International Business Machines Corporation and Subsidiary Companies
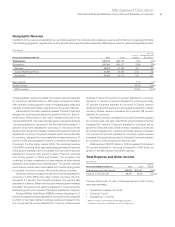
The timing and amount of sales and other transfers of IP may
vary significantly from period to period depending upon timing of
divestitures, industry consolidation, economic conditions and the
timing of new patents and know-how development. There were
no significant individual IP transactions in 2010 or 2009.
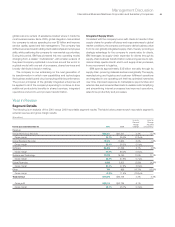
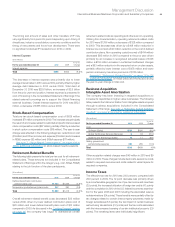
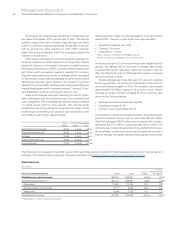
Interest Expense
($ in millions)
Yr.-to-Yr.
For the year ended December 31: 2010 2009 Change
Interest expense
To t a l $368 $402 (8.5)%
The decrease in interest expense was primarily due to lower
average interest rates in 2010 versus 2009, partially offset by higher
average debt balances in 2010 versus 2009. Total debt at
December 31, 2010 was $28.6 billion; an increase of $2.5 billion
from the prior year-end position. Interest expense is presented in
cost of financing in the Consolidated State ment of Earnings if the
related external borrowings are to support the Global Financing
external business. Overall interest expense for 2010 was $923
million, a decrease of $185 million versus 2009.
Stock-Based Compensation
Total pre-tax stock-based compensation cost of $629 million
increased $71 million compared to 2009. The increase was principally
the result of an increase related to restricted and performance-based
stock compensation costs ($87 million), partially offset by a reduction
in stock option compensation costs ($16 million). The year-to-year
change was reflected in the following categories: reductions in cost
($1 million) and Other (income) and expense ($1 million) and increases
in RD&E expense ($2 million) and SG&A expense ($71 million).
See note T, “Stock-Based Compensation,” on pages 109 to
112 for additional information on stock-based incentive awards.
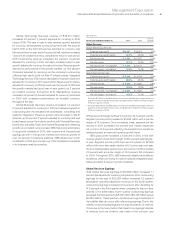
Retirement-Related Benefits
The following table presents the total pre-tax cost for all retirement-
related plans. These amounts are included in the Consolidated
Statement of Earnings within the category (e.g., cost, SG&A, RD&E)
relating to the job function of the plan participants.
($ in millions)
Yr.-to-Yr.
For the year ended December 31: 2010 2009 Change
Defined benefit and contribution
pension plans cost $1,035 $1,065 (2.8)%
Nonpension postretirement plans costs 347 350 (0.9)
Tot a l $1,382 $1,415 (2.3)%
Overall retirement-related benefit costs decreased $33 million
versus 2009, driven by lower defined contribution plans cost of
$20 million and lower defined benefit plans cost of $10 million
compared to 2009. As discussed in the “Looking Forward” section
on page 46, the company has begun to characterize certain
retirement-related costs as operating and others as non-operating.
Utilizing this characterization, operating retirement-related costs
for 2010 were $1,796 million, a decrease of $128 million compared
to 2009. This decrease was driven by a $108 million reduction in
total service cost and a $20 million reduction in the cost of defined
contribution plans. Non-operating costs/(income) of ($414 million)
decreased $95 million in 2010 compared to the prior year driven
primarily by an increase in recognized actuarial losses of $148
million, a $153 million increase in curtailment settlement charges
and a $63 million reduction in the expected return on plan assets,
partially offset by lower interest cost of $158 million and lower
pension insolvency insurance premiums of $118 million.
See note U, “Retirement-Related Benefits,” on pages 112 to 126
for additional information on these plans and the factors driving
the year-to-year change in total cost.
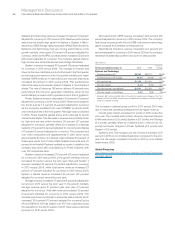
Business Acquisition
Intangible Asset Amortization
The company has been investing in targeted acquisitions to
increase its capabilities in higher value businesses. The following
table presents the total amortization from intangible assets acquired
through business acquisitions included in the Consol idated
Statement of Earnings. See note J, “Intangible Assets Including
Goodwill,” on pages 93 and 94 for additional information.
($ in millions)
Yr.-to-Yr.
For the year ended December 31: 2010 2009 Change
Cost:
Software (Sales) $239 $160 49.0%
Global Technology Services (Services) 6 33 (81.7)
Systems and Technology (Sales) 15 11 39.8
Selling, general and
administrative expense 253 285 (11.3)
To t a l $513 $489 4.9%
Other acquisition-related charges were $45 million in 2010 and $9
million in 2009. These charges include deal costs, severance costs
related to acquired resources and costs related to vacant space for
acquired companies.
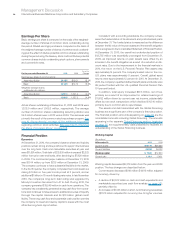
Income Taxes
The effective tax rate for 2010 was 24.8 percent, compared with
26.0 percent in 2009. The 1.2 point decrease was primarily driven
by a more favorable geographic mix of pre-tax income and incentives
(2.5 points), the increased utilization of foreign tax credits (4.1 points)
and the completion in 2010 of the U.S. federal income tax examina-
tion for the years 2006 and 2007 including the associated reserve
redeterminations (6.4 points). These benefits were partially offset by
tax charges related to certain intercompany payments made by
foreign subsidiaries (6.6 points), the tax impact of certain business
restructuring transactions (2.7 points) and the tax costs associated
with the intercompany licensing of certain intellectual property (2.9
points). The remaining items were individually insignificant.