IBM 2010 Annual Report Download - page 113
Download and view the complete annual report
Please find page 113 of the 2010 IBM annual report below. You can navigate through the pages in the report by either clicking on the pages listed below, or by using the keyword search tool below to find specific information within the annual report.-
 1
1 -
2
-
3
-
4
-
5
-
6
-
7
-
8
-
9
-
10
-
11
-
12
-
13
-
14
-
15
-
16
-
17
-
18
-
19
-
20
-
21
-
22
-
23
-
24
-
25
-
26
-
27
-
28
-
29
-
30
-
31
-
32
-
33
-
34
-
35
-
36
-
37
-
38
-
39
-
40
-
41
-
42
-
43
-
44
-
45
-
46
-
47
-
48
-
49
-
50
-
51
-
52
-
53
-
54
-
55
-
56
-
57
-
58
-
59
-
60
-
61
-
62
-
63
-
64
-
65
-
66
-
67
-
68
-
69
-
70
-
71
-
72
-
73
-
74
-
75
-
76
-
77
-
78
-
79
-
80
-
81
-
82
-
83
-
84
-
85
-
86
-
87
-
88
-
89
-
90
-
91
-
92
-
93
-
94
-
95
-
96
-
97
-
98
-
99
-
100
-
101
-
102
-
 103
103 -
 104
104 -
 105
105 -
 106
106 -
 107
107 -
 108
108 -
 109
109 -
 110
110 -
 111
111 -
 112
112 -
 113
113 -
 114
114 -
 115
115 -
 116
116 -
 117
117 -
 118
118 -
 119
119 -
 120
120 -
 121
121 -
 122
122 -
 123
123 -
124
-
125
-
126
-
127
-
128
-
129
-
130
-
131
-
132
-
133
-
134
-
135
-
136
-
137
-
138
-
139
-
140
 |
 |

Notes to Consolidated Financial Statements
International Business Machines Corporation and Subsidiary Companies 111
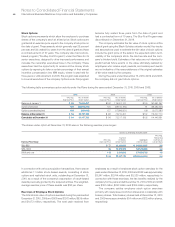
Stock Awards
In lieu of stock options, the company currently grants its employees stock awards. These awards are made in the form of Restricted Stock
Units (RSUs), including Retention Restricted Stock Units (RRSUs), or Performance Share Units (PSUs).
The tables below summarize RSU and PSU activity under the Plans during the years ended December 31, 2010, 2009 and 2008.
RSUs are stock awards granted to employees that entitle the
holder to shares of common stock as the award vests, typically
over a one- to five-year period. The fair value of the awards is
determined and fixed on the grant date based on the company’s
stock price. RSUs granted to employees prior to January 1, 2008
are considered participating securities as they receive non-
forfeitable dividend equivalents at the same rate as common stock.
Any unvested awards that contain these rights are included in
computing earnings per share pursuant to the two-class method.
For RSUs awarded on or after January 1, 2008, dividend equivalents
were not paid. The fair value of such RSUs is determined and fixed
on the grant date based on the company’s stock price adjusted
for the exclusion of dividend equivalents.
The remaining weighted-average contractual term of RSUs at
December 31, 2010, 2009 and 2008 is the same as the period
over which the remaining cost of the awards will be recognized,
which is approximately three years. The fair value of RSUs granted
during the years ended December 31, 2010, 2009 and 2008 was
$421 million, $467 million and $490 million, respectively. The total
fair value of RSUs vested and released during the years ended
December 31, 2010, 2009 and 2008 was $503 million, $272 million
and $311 million, respectively. As of December 31, 2010, 2009 and
2008, there was $865 million, $892 million and $863 million,
respectively, of unrecognized compensation cost related to non-
vested RSUs. The company received no cash from employees as
a result of employee vesting and release of RSUs for the years
ended December 31, 2010, 2009 and 2008. In January 2011, the
company announced that it plans to grant equity awards valued
at $1 thousand each to about 400,000 non-executive employees
in the second quarter of 2011. These awards would be made under
the Plans and would vest in December 2015.
PSUs are stock awards where the number of shares ultimately
received by the employee depends on the company’s perfor-
mance against specified targets and typically vest over a three-
year period. The fair value of each PSU is determined on the grant
date, based on the company’s stock price, and assumes that
performance targets will be achieved. Over the performance
period, the number of shares of stock that will be issued is
adjusted upward or downward based upon the probability of
achievement of performance targets. The ultimate number of
shares issued and the related compensation cost recognized as
expense will be based on a comparison of the final performance
metrics to the specified targets. The fair value of PSUs granted
during the years ended December 31, 2010, 2009 and 2008 was
$145 million, $159 million and $126 million, respectively. Total fair
value of PSUs vested and released during the years ended
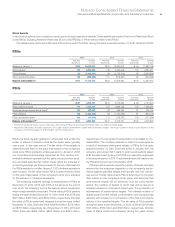
RSUs
2010 2009 2008
Wtd. Avg. Number Wtd. Avg. Number Wtd. Avg. Number
Grant Price of Units Grant Price of Units Grant Price of Units
Balance at January 1 $102 13,405,654 $100 12,397,515 $ 94 11,887,746
RSUs granted 122 3,459,303 105 4,432,449 107 4,587,011
RSUs released 98 (5,102,951) 99 (2,748,613) 88 (3,526,580)
RSUs canceled/forfeited 105 (565,560) 101 (675,697) 98 (550,662)
Balance at December 31 $110 11,196,446 $102 13,405,654 $100 12,397,515
PSUs
2010 2009 2008
Wtd. Avg. Number Wtd. Avg. Number Wtd. Avg. Number
Grant Price of Units Grant Price of Units Grant Price of Units
Balance at January 1 $107 3,476,737 $102 3,078,694 $ 93 2,783,823
PSUs granted at target 117 1,239,468 101 1,568,129 119 1,058,381
Additional shares earned above target* 103 463,913 83 396,794 91 275,190
PSUs released 103 (1,486,484) 83 (1,440,099) 91 (860,705)
PSUs canceled/forfeited 108 (44,346) 111 (126,781) 102 (177,995)
Balance at December 31** $111 3,649,288 $107 3,476,737 $102 3,078,694
* Represents additional shares issued to employees after vesting of PSUs because final performance metrics exceeded specified targets.
** Represents the number of shares expected to be issued based on achievement of grant date performance targets. The actual number of shares issued depends on the
company’s performance against specified targets over the vesting period.