IBM 2010 Annual Report Download - page 123
Download and view the complete annual report
Please find page 123 of the 2010 IBM annual report below. You can navigate through the pages in the report by either clicking on the pages listed below, or by using the keyword search tool below to find specific information within the annual report.-
 1
1 -
2
-
3
-
4
-
5
-
6
-
7
-
8
-
9
-
10
-
11
-
12
-
13
-
14
-
15
-
16
-
17
-
18
-
19
-
20
-
21
-
22
-
23
-
24
-
25
-
26
-
27
-
28
-
29
-
30
-
31
-
32
-
33
-
34
-
35
-
36
-
37
-
38
-
39
-
40
-
41
-
42
-
43
-
44
-
45
-
46
-
47
-
48
-
49
-
50
-
51
-
52
-
53
-
54
-
55
-
56
-
57
-
58
-
59
-
60
-
61
-
62
-
63
-
64
-
65
-
66
-
67
-
68
-
69
-
70
-
71
-
72
-
73
-
74
-
75
-
76
-
77
-
78
-
79
-
80
-
81
-
82
-
83
-
84
-
85
-
86
-
87
-
88
-
89
-
90
-
91
-
92
-
93
-
94
-
95
-
96
-
97
-
98
-
99
-
100
-
101
-
102
-
103
-
104
-
105
-
106
-
107
-
108
-
109
-
110
-
111
-
112
-
 113
113 -
 114
114 -
 115
115 -
 116
116 -
 117
117 -
 118
118 -
 119
119 -
 120
120 -
 121
121 -
 122
122 -
 123
123 -
 124
124 -
 125
125 -
 126
126 -
 127
127 -
 128
128 -
 129
129 -
 130
130 -
 131
131 -
 132
132 -
 133
133 -
134
-
135
-
136
-
137
-
138
-
139
-
140
 |
 |

Notes to Consolidated Financial Statements
International Business Machines Corporation and Subsidiary Companies 121
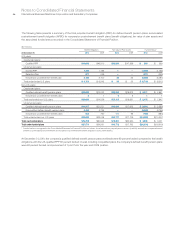
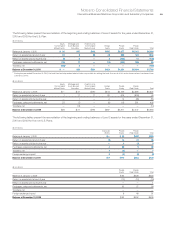
Defined Benefit Pension Plan Assets
The following table presents the company’s defined benefit pension plans’ asset classes and their associated fair value at December 31,
2010. The U.S. Plan consists of the Qualified PPP and the Non-U.S. Plans consist of all plans sponsored by the company’s subsidiaries.
($ in millions)
U.S. Plan Non-U.S. Plans
Level 1 Level 2 Level 3 Total Level 1 Level 2 Level 3 Total
Equity:
Equity securities
(a) $16,407 $ 54 $ — $16,460 $7,903 $ — $ — $ 7,903
Equity commingled/mutual funds
(b)(c) 27 1,829 — 1,856 276 9,252 — 9,527
Fixed income:
Government and related
(d) — 12,743 — 12,743 — 7,574 — 7,574
Corporate bonds — 6,721 — 6,721 — 1,252 11 1,263
Mortgage and asset-backed securities — 1,147 56 1,202 — 45 — 45
Fixed income commingled/mutual funds
(b)(e) 252 662 221 1,136 75 6,993 — 7,068
Insurance contracts — — — — — 1,095 — 1,095
Cash and short-term investments
(f) 244 2,000 — 2,244 147 254 — 401
Hedge funds — 953 624 1,577 — — — —
Private equity
(g) — — 4,251 4,251 — — 176 176
Private real estate
(g) — — 2,634 2,634 — — 533 533
Derivatives (h) 31 9 — 40 11 131 — 142
Other commingled/mutual funds
(b)(i) — — — — — 28 — 28
Subtotal 16,960 26,117 7,786 50,863 8,411 26,623 720 35,755
Other (j) — — — (603) — — — (33)
Fair value of plan assets $16,960 $26,117 $7,786 $50,259 $8,411 $26,623 $720 $35,722
(a) Represents U.S. and international securities. The U.S. Plan includes IBM common stock of $122 million, representing 0.2 percent of the U.S. Plan assets. Non-U.S. Plans include
IBM common stock of $32 million, representing 0.1 percent of the non-U.S. Plans assets.
(b) Commingled funds represent pooled institutional investments.
(c) Invests in predominantly equity securities.
(d) Includes debt issued by national, state and local governments and agencies.
(e) Invests in predominantly fixed income securities.
(f) Includes cash and cash equivalents and short-term marketable securities.
(g) Includes limited partnerships and venture capital partnerships.
(h) Primarily includes interest rate derivatives and, to a lesser extent, forwards, exchange traded and other over-the-counter derivatives.
(i) Invests in both equity and fixed income securities.
(j) Represents net unsettled transactions, relating primarily to purchases and sales of plan assets.
The U.S. nonpension postretirement benefit plan assets of $35 million were invested in cash, categorized as Level 1 in the fair value hierarchy.
The non-U.S. nonpension postretirement benefit plan assets of $120 million, primarily in Brazil, and, to a lesser extent, in Mexico and South
Africa, were invested primarily in government and related fixed income securities, categorized as Level 2 in the fair value hierarchy.