Capital One 2007 Annual Report Download - page 99
Download and view the complete annual report
Please find page 99 of the 2007 Capital One annual report below. You can navigate through the pages in the report by either clicking on the pages listed below, or by using the keyword search tool below to find specific information within the annual report.-
 1
1 -
2
-
3
-
4
-
5
-
6
-
7
-
8
-
9
-
10
-
11
-
12
-
13
-
14
-
15
-
16
-
17
-
18
-
19
-
20
-
21
-
22
-
23
-
24
-
25
-
26
-
27
-
28
-
29
-
30
-
31
-
32
-
33
-
34
-
35
-
36
-
37
-
38
-
39
-
40
-
41
-
42
-
43
-
44
-
45
-
46
-
47
-
48
-
49
-
50
-
51
-
52
-
53
-
54
-
55
-
56
-
57
-
58
-
59
-
60
-
61
-
62
-
63
-
64
-
65
-
66
-
67
-
68
-
69
-
70
-
71
-
72
-
73
-
74
-
75
-
76
-
77
-
78
-
79
-
80
-
81
-
82
-
83
-
84
-
85
-
86
-
87
-
88
-
 89
89 -
 90
90 -
 91
91 -
 92
92 -
 93
93 -
 94
94 -
 95
95 -
 96
96 -
 97
97 -
 98
98 -
 99
99 -
 100
100 -
 101
101 -
 102
102 -
 103
103 -
 104
104 -
 105
105 -
 106
106 -
 107
107 -
 108
108 -
 109
109 -
110
-
111
-
112
-
113
-
114
-
115
-
116
-
117
-
118
-
119
-
120
-
121
-
122
-
123
-
124
-
125
-
126
-
127
-
128
-
129
-
130
-
131
-
132
-
133
-
134
-
135
-
136
-
137
-
138
-
139
-
140
-
141
-
142
-
143
-
144
-
145
-
146
-
147
 |
 |

77
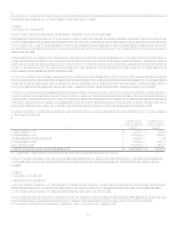
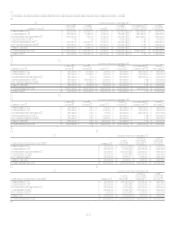
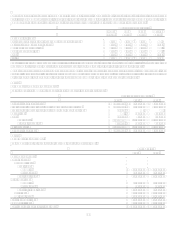
The following tables present certain information regarding our continuing operations by segment:
Year Ended December 31, 2007
Total Company National
Lending Local
Banking Other Total
Managed Securitization
Adjustments(1) Total
Reported
Net interest income $ 8,854,459 $ 2,322,828 $ (157,537) $ 11,019,750 $ (4,489,905) $ 6,529,845
Non-interest income 5,012,099 798,268 (44,599) 5,765,768 2,288,455 8,054,223
Provision for loan and lease losses 4,691,779 32,085 114,088 4,837,952 (2,201,450) 2,636,502
Restructuring expenses 138,237 138,237 138,237
Other non-interest expenses 5,545,898 2,208,262 185,613 7,939,773 7,939,773
Income tax provision (benefit) 1,247,073 306,553 (275,789) 1,277,837 1,277,837
Net income (loss) $ 2,381,808 $ 574,196 $ (364,285) $ 2,591,719 $ 2,591,719
Loans held for investment $ 106,508,443 $ 43,972,795 $ 881,179 $ 151,362,417 $ (49,557,390) $ 101,805,027
Total deposits $ 2,050,861 $ 73,318,570 $ 7,621,031 $ 82,990,462 $ $ 82,990,462
Year Ended December 31, 2006
Total Company National
Lending Local
Banking Other(2) Total
Managed Securitization
Adjustments(1) Total
Reported
Net interest income $ 7,906,186 $ 996,929 $ 29,578 $ 8,932,693 $ (3,841,247) $ 5,091,446
Non-interest income 4,524,152 446,071 (62,942) 4,907,281 2,093,743 7,001,024
Provision for loan and lease losses 3,207,849 399 15,694 3,223,942 (1,747,504) 1,476,438
Other non-interest expenses 5,631,100 1,167,873 144,718 6,943,691 6,943,691
Income tax provision (benefit) 1,260,518 96,155 (110,709) 1,245,964 1,245,964
Net income (loss) $ 2,330,871 $ 178,573 $ (83,067) $ 2,426,377 $ 2,426,377
Loans held for investment $ 102,359,180 $ 12,145,533 $ 31,646,555 $ 146,151,268 $ (49,639,129) $ 96,512,139
Total deposits $ 2,383,902 $ 35,334,610 $ 48,052,380 $ 85,770,892 $ $ 85,770,892
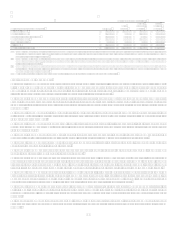
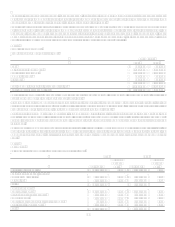
Year Ended December 31, 2005
Total Company National
Lending Local
Banking Other(2) Total
Managed Securitization
Adjustments(1) Total
Reported
Net interest income $ 7,623,855 N/A $ 31,599 $ 7,655,454 $ (3,975,212) $ 3,680,242
Non-interest income 4,364,164 N/A 195,234 4,559,398 1,798,707 6,358,105
Provision for loan and lease losses 3,664,399 N/A 3,178 3,667,577 (2,176,505) 1,491,072
Other non-interest expenses 5,359,758 N/A 358,515 5,718,273 5,718,273
Income tax provision (benefit) 1,036,415 N/A (16,560) 1,019,855 1,019,855
Net income (loss) $ 1,927,447 N/A $ (118,300) $ 1,809,147 $ 1,809,147
Loans held for investment $ 89,222,031 N/A $ 16,305,460 $ 105,527,491 $ (45,679,810) $ 59,847,681
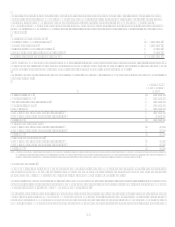
Year Ended December 31, 2007
National Lending sub-segment detail U.S. Card Auto
Finance
Global
Financial
Services
Total
National
Lending
Net interest income $ 5,242,181 $ 1,510,869 $ 2,101,409 $ 8,854,459
Non-interest income 3,643,359 112,261 1,256,479 5,012,099
Provision for loan and lease losses 2,351,966 1,056,120 1,283,693 4,691,779
Non-interest expenses 3,307,576 618,568 1,619,754 5,545,898
Income tax provision 1,109,743 (17,736) 155,066 1,247,073
Net income (loss) $ 2,116,255 $ (33,822) $ 299,375 $ 2,381,808
Loans held for investment $ 52,078,847 $ 25,128,352 $ 29,301,244 $ 106,508,443
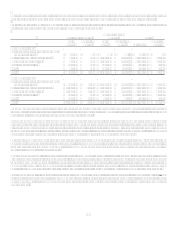
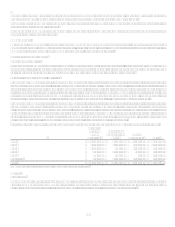
Year Ended December 31, 2006
National Lending sub-segment detail U.S. Card Auto
Finance
Global
Financial
Services
Total
National
Lending
Net interest income $ 4,715,798 $ 1,372,517 $ 1,817,871 $ 7,906,186
Non-interest income 3,255,681 81,384 1,187,087 4,524,152
Provision for loan and lease losses 1,644,619 494,835 1,068,395 3,207,849
Non-interest expenses 3,521,627 599,807 1,509,666 5,631,100
Income tax provision 981,833 125,740 152,945 1,260,518
Net income $ 1,823,400 $ 233,519 $ 273,952 $ 2,330,871
Loans held for investment $ 53,623,680 $ 21,751,827 $ 26,983,673 $ 102,359,180