Capital One 2007 Annual Report Download - page 11
Download and view the complete annual report
Please find page 11 of the 2007 Capital One annual report below. You can navigate through the pages in the report by either clicking on the pages listed below, or by using the keyword search tool below to find specific information within the annual report.-
 1
1 -
 2
2 -
 3
3 -
 4
4 -
 5
5 -
 6
6 -
 7
7 -
 8
8 -
 9
9 -
 10
10 -
 11
11 -
 12
12 -
 13
13 -
 14
14 -
 15
15 -
 16
16 -
 17
17 -
 18
18 -
 19
19 -
 20
20 -
 21
21 -
 22
22 -
23
-
24
-
25
-
26
-
27
-
28
-
29
-
30
-
31
-
32
-
33
-
34
-
35
-
36
-
37
-
38
-
39
-
40
-
41
-
42
-
43
-
44
-
45
-
46
-
47
-
48
-
49
-
50
-
51
-
52
-
53
-
54
-
55
-
56
-
57
-
58
-
59
-
60
-
61
-
62
-
63
-
64
-
65
-
66
-
67
-
68
-
69
-
70
-
71
-
72
-
73
-
74
-
75
-
76
-
77
-
78
-
79
-
80
-
81
-
82
-
83
-
84
-
85
-
86
-
87
-
88
-
89
-
90
-
91
-
92
-
93
-
94
-
95
-
96
-
97
-
98
-
99
-
100
-
101
-
102
-
103
-
104
-
105
-
106
-
107
-
108
-
109
-
110
-
111
-
112
-
113
-
114
-
115
-
116
-
117
-
118
-
119
-
120
-
121
-
122
-
123
-
124
-
125
-
126
-
127
-
128
-
129
-
130
-
131
-
132
-
133
-
134
-
135
-
136
-
137
-
138
-
139
-
140
-
141
-
142
-
143
-
144
-
145
-
146
-
147
 |
 |

the first place. We made these choices well before the industry was under a spotlight.
And we believe that they are driving long-term customer loyalty and profitability.
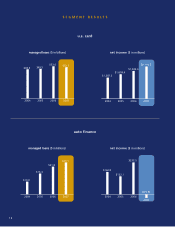
Auto Finance
This was a particularly challenging year for the auto finance industry and for
Capital One Auto Finance (COAF). COAF’s net loss for the year was $34 million, down
114 percent from 2006, with credit deterioration driving the bulk of the profitability
decrease. Origination volumes were up 5 percent year-over-year, adjusted for the
addition of the North Fork auto portfolio. Over the years, we have built a competitive,
scale business in auto finance, becoming the second largest non-captive auto lender in
the United States. However, COAF’s results this year were unsatisfactory.
We have taken decisive action to address the challenges in our auto finance business.
We introduced second and third generation credit models in our prime auto business
that have much tighter credit criteria. We pulled back from selected segments of the
auto finance market, scaling back originations to reflect the uncertainties in the credit
environment and focusing only on the most profitable and resilient segments. We took
advantage of market opportunities later in 2007 to make loans with significantly higher
credit scores and leveraged our pricing power to improve margins. We continued to
aggressively reduce costs and increase operating leverage. We slowed or stopped
growth in areas most impacted by home price depreciation. And we cut higher risk
dealerships that have worse overall credit performance on a portfolio basis.
The year’s brightest spot for COAF was the introduction of our new dealer relationship
model. We have integrated the various programs from our legacy auto acquisitions and
now are presenting one integrated face to the dealer. Early returns are promising. Our
dealer satisfaction, as measured by J.D. Power, went up 32 percent in a short amount
of time. Our deeper dealer relationships typically generate more loans from each dealer
with better credit quality.
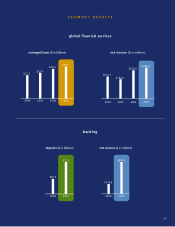
Global Financial Services
Global Financial Services, or GFS, is our portfolio of emerging national scale growth
businesses, including small business, home loans, installment lending, healthcare
finance, and our UK and Canadian businesses. GFS delivered a solid year, despite credit
pressures in the United States and the UK, with net income of $299 million in 2007,
up 9 percent from 2006, and managed loan growth of $2 billion, or 9 percent. GFS
continued to provide meaningful diversification and growth to the company, while
delivering solid returns on allocated capital of 17 percent.
9