Capital One 2007 Annual Report Download - page 62
Download and view the complete annual report
Please find page 62 of the 2007 Capital One annual report below. You can navigate through the pages in the report by either clicking on the pages listed below, or by using the keyword search tool below to find specific information within the annual report.-
 1
1 -
2
-
3
-
4
-
5
-
6
-
7
-
8
-
9
-
10
-
11
-
12
-
13
-
14
-
15
-
16
-
17
-
18
-
19
-
20
-
21
-
22
-
23
-
24
-
25
-
26
-
27
-
28
-
29
-
30
-
31
-
32
-
33
-
34
-
35
-
36
-
37
-
38
-
39
-
40
-
41
-
42
-
43
-
44
-
45
-
46
-
47
-
48
-
49
-
50
-
51
-
 52
52 -
 53
53 -
 54
54 -
 55
55 -
 56
56 -
 57
57 -
 58
58 -
 59
59 -
 60
60 -
 61
61 -
 62
62 -
 63
63 -
 64
64 -
 65
65 -
 66
66 -
 67
67 -
 68
68 -
 69
69 -
 70
70 -
 71
71 -
 72
72 -
73
-
74
-
75
-
76
-
77
-
78
-
79
-
80
-
81
-
82
-
83
-
84
-
85
-
86
-
87
-
88
-
89
-
90
-
91
-
92
-
93
-
94
-
95
-
96
-
97
-
98
-
99
-
100
-
101
-
102
-
103
-
104
-
105
-
106
-
107
-
108
-
109
-
110
-
111
-
112
-
113
-
114
-
115
-
116
-
117
-
118
-
119
-
120
-
121
-
122
-
123
-
124
-
125
-
126
-
127
-
128
-
129
-
130
-
131
-
132
-
133
-
134
-
135
-
136
-
137
-
138
-
139
-
140
-
141
-
142
-
143
-
144
-
145
-
146
-
147
 |
 |

40
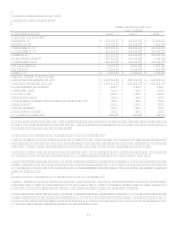
higher percentage of lower yielding loans than the Hibernia portfolio. Net interest margins on deposits are higher in 2007 than in 2006
because of the addition of the lower cost North Fork deposit portfolio to the existing Hibernia and Capital One deposits.
The provision for loan losses increased to $32.1 million in 2007 from $0.4 million in 2006. The increase is primarily the result of the
addition of the North Fork loan portfolios in 2007, offset by a $91.4 million reduction in the allowance for loan losses to conform the
allowance for loan losses methodology of the Local Banking segment to the Companys established methodology. In addition, during
2006, $25.7 million of allowance for loan losses previously established to cover expected losses in the portion of the loan portfolio
impacted by Hurricanes Katrina and Rita was no longer needed and these amounts reduced the overall provision expense in 2006.
Non-interest expenses were $2.2 billion in 2007, compared to $1.2 billion in 2006. The primary reason for the increase is the addition
of North Fork to the Local Banking segment results in 2007. In addition, during 2007 the Local Banking segment continued to incur
costs associated with the integration of Hibernia and North Fork. These activities progressed as planned during the year and all
Hibernia related integration activities were completed. In 2007, the Company opened 39 new banking locations across Louisiana, New
Jersey, New York, Texas and Virginia. The costs of operating these branches, including lease costs, depreciation and personnel, is
included in non-interest expense.
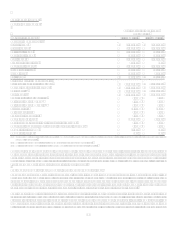
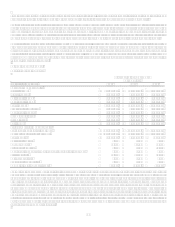
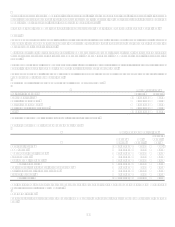
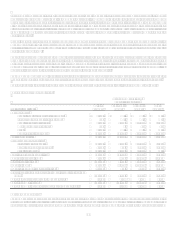
National Lending Segment
Table 3: National Lending
As of and for the Year Ended
December 31,
(Dollars in thousands) 2007 2006 2005
Earnings (Managed Basis)
Interest income $ 13,703,044 $ 12,088,876 $ 10,891,610
Interest expense 4,848,585 4,182,690 3,267,755
Net interest income 8,854,459 7,906,186 7,623,855
Non-interest income 5,012,099 4,524,152 4,364,164
Total revenue 13,866,558 12,430,338 11,988,019
Provision for loan losses 4,691,779 3,207,849 3,664,399
Non-interest expense 5,545,898 5,631,100 5,359,758
Income before taxes 3,628,881 3,591,389 2,963,862
Income taxes 1,247,073 1,260,518 1,036,415
Net income $ 2,381,808 $ 2,330,871 $ 1,927,447
Selected Metrics (Managed Basis)
Period end loans held for investment $ 106,508,443 $ 102,359,180 $ 89,222,031
Average loans held for investment $ 102,235,384 $ 95,396,391 $ 83,218,086
Total deposits $ 2,050,861 $ 2,383,902 $ 151,498
Net interest margin 8.66% 8.29% 9.16%
Revenue margin 13.56% 13.03% 14.41%
Risk adjusted margin 9.61% 9.79% 10.07%
Non-interest expense as a % of average loans held for investment 5.42% 5.90% 6.44%
Efficiency ratio 39.99% 45.30% 44.71%
Net charge-off rate 3.96% 3.24% 4.34%
30+ day delinquency rate 5.17% 4.09% 3.70%
Number of Total Accounts (000s) 48,537 49,374 48,790
The National Lending segment consists of three sub-segments: U.S. Card, Auto Finance and Global Financial Services. The National
Lending segment contributed $2.4 billion of net income during 2007, compared to $2.3 billion during 2006. At December 31 2007,
loans outstanding in the National Lending segment totaled $106.5 billion while deposits outstanding totaled $2.1 billion. Profits are
primarily generated from net interest income and past-due fees earned and deemed collectible from our loans, income earned on
securities, and non-interest income including the sale and servicing of loans and fee-based services to customers. Total revenue
increased 12% during 2007 primarily due to growth in the average managed loans held for investment portfolio of 7% and selective
pricing and fee changes following conversion of our cardholder system. Provision for loan and lease losses increased $1.5 billion, or
46%, during 2007, compared to 2006 due to normalization of credit following the unusually favorable credit environment in 2006,
selective pricing and fee policy moves in the U.S. Card sub-segment, the significant pull back from prime revolver marketing in the
U.S. Card sub-segment, continued elevated losses in the Auto Finance sub-segment, and from economic weakening consistent with
recently released economic indicators.