Capital One 2007 Annual Report Download - page 86
Download and view the complete annual report
Please find page 86 of the 2007 Capital One annual report below. You can navigate through the pages in the report by either clicking on the pages listed below, or by using the keyword search tool below to find specific information within the annual report.-
 1
1 -
2
-
3
-
4
-
5
-
6
-
7
-
8
-
9
-
10
-
11
-
12
-
13
-
14
-
15
-
16
-
17
-
18
-
19
-
20
-
21
-
22
-
23
-
24
-
25
-
26
-
27
-
28
-
29
-
30
-
31
-
32
-
33
-
34
-
35
-
36
-
37
-
38
-
39
-
40
-
41
-
42
-
43
-
44
-
45
-
46
-
47
-
48
-
49
-
50
-
51
-
52
-
53
-
54
-
55
-
56
-
57
-
58
-
59
-
60
-
61
-
62
-
63
-
64
-
65
-
66
-
67
-
68
-
69
-
70
-
71
-
72
-
73
-
74
-
75
-
 76
76 -
 77
77 -
 78
78 -
 79
79 -
 80
80 -
 81
81 -
 82
82 -
 83
83 -
 84
84 -
 85
85 -
 86
86 -
 87
87 -
 88
88 -
 89
89 -
 90
90 -
 91
91 -
 92
92 -
 93
93 -
 94
94 -
 95
95 -
 96
96 -
97
-
98
-
99
-
100
-
101
-
102
-
103
-
104
-
105
-
106
-
107
-
108
-
109
-
110
-
111
-
112
-
113
-
114
-
115
-
116
-
117
-
118
-
119
-
120
-
121
-
122
-
123
-
124
-
125
-
126
-
127
-
128
-
129
-
130
-
131
-
132
-
133
-
134
-
135
-
136
-
137
-
138
-
139
-
140
-
141
-
142
-
143
-
144
-
145
-
146
-
147
 |
 |

64
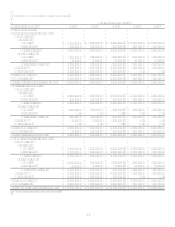
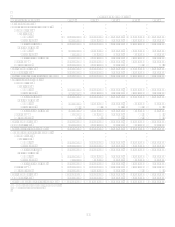
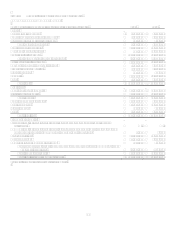
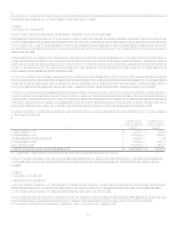
CONSOLIDATED STATEMENTS OF CHANGES IN STOCKHOLDERS EQUITY
Common Stock
(In Thousands, Except Per Share Data) Shares Amount
Paid-In
Capital,
Net
Retained
Earnings
Cumulative Other
Comprehensive
Income (Loss)
Treasury
Stock
Total
Stockholders
Equity
Balance, December 31, 2004 248,354,259 $ 2,484 $ 2,711,327 $ 5,596,372 $ 144,759 $ (66,753) $ 8,388,189
Comprehensive income:
Net income 1,809,147 1,809,147
Other comprehensive income, net of income tax:
Unrealized losses on securities, net of income tax benefit of $31,706 (54,876) (54,876)
Foreign currency translation adjustments (113,189) (113,189)
Unrealized gains in cash flow hedging instruments, net of income taxes of $21,373 29,435 29,435
Other comprehensive income (138,630) (138,630)
Comprehensive income 1,670,517
Cash dividends$.11 per share (27,504) (27,504)
Purchase of treasury stock (40,049) (40,049)
Issuances of common stock and restricted stock, net of forfeitures 11,059,437 110 761,371 761,481
Exercise of stock options and tax benefits of exercises and restricted stock vesting 10,489,976 105 506,897 507,002
Compensation expense for restricted stock awards and stock options 149,496 149,496
Adjustment to issuance of common stock for acquisition 32,882,772 329 2,710,623 2,710,952
Allocation of ESOP shares 8,830 8,830
Balance, December 31, 2005 302,786,444 3,028 6,848,544 7,378,015 6,129 (106,802) 14,128,914
Comprehensive income:
Net income 2,414,493 2,414,493
Other comprehensive income, net of income tax:
Unrealized gains on securities, net of income taxes of $16,635 24,119 24,119
Recognition of additional minimum pension liability, net of income tax benefit of $1,025 (1,903) (1,903)
Foreign currency translation adjustments 246,066 246,066
Unrealized losses on cash flow hedging instruments, net of income tax benefit of $6,750 (13,573) (13,573)
Other comprehensive income 254,709 254.709
Comprehensive income 2,669,202
Adjustment to initially apply FASB Statement No. 158, net of income taxes of $2,876 5,342 5,342
Cash dividends$.11 per share (32,324) (32,324)
Purchase of treasury stock (21,615) (21,615)
Issuances of common stock and restricted stock, net of forfeitures 1,550,117 16 31,395 31,411
Exercise of stock options and tax benefits of exercises and restricted stock vesting 3,934,592 39 261,139 261,178
Compensation expense for restricted stock awards and stock options 180,261 180,261
Adjustment to issuance of common stock for acquisition 103,948,820 1,039 8,006,458 8,007,497
Allocation of ESOP shares 5,340 5,340
Balance, December 31, 2006 412,219,973 4,122 15,333,137 9,760,184 266,180 (128,417) 25,235,206
Cumulative effect from adoption of FIN 48 (29,702) (29,702)
Cumulative effect from adoption of FAS 156, net of income taxes of $6,378 8,809 8,809
Comprehensive income:
Net income 1,570,332 1,570,332
Other comprehensive income, net of income tax:
Unrealized gains on securities, net of income tax of $25,780 56,413 56,413
Defined benefit plans, net of income taxes of $17,675 29,407
29,407
Foreign currency translation adjustments 83,499 83,499
Unrealized losses on cash flow hedging instruments, net of income tax benefit of $63,804 (120,251) (120,251)
Other comprehensive income 49,068 49,068
Comprehensive income 1,619,400
Cash dividends$.11 per share (42,055) (42,055)
Purchase of treasury stock (3,024,969) (3,024,969)
Issuances of common stock and restricted stock, net of forfeitures 1,916,402 20 37,182 37,202
Exercise of stock options and tax benefits of exercises and restricted stock vesting 5,225,783 51 301,921 301,972
Compensation Expense for restricted stock awards and stock options 192,422 192,422
Adjustment to issuance of common stock for acquisition (137,258) (1) (10,463) (10,464)
Allocation of ESOP shares 6,291 6,291
Balance, December 31, 2007 419,224,900 $ 4,192 $ 15,860,490 $ 11,267,568 $ 315,248 $ (3,153,386) $ 24,294,112
See Notes to Consolidated Financial Statements.