Capital One 2007 Annual Report Download - page 80
Download and view the complete annual report
Please find page 80 of the 2007 Capital One annual report below. You can navigate through the pages in the report by either clicking on the pages listed below, or by using the keyword search tool below to find specific information within the annual report.-
 1
1 -
2
-
3
-
4
-
5
-
6
-
7
-
8
-
9
-
10
-
11
-
12
-
13
-
14
-
15
-
16
-
17
-
18
-
19
-
20
-
21
-
22
-
23
-
24
-
25
-
26
-
27
-
28
-
29
-
30
-
31
-
32
-
33
-
34
-
35
-
36
-
37
-
38
-
39
-
40
-
41
-
42
-
43
-
44
-
45
-
46
-
47
-
48
-
49
-
50
-
51
-
52
-
53
-
54
-
55
-
56
-
57
-
58
-
59
-
60
-
61
-
62
-
63
-
64
-
65
-
66
-
67
-
68
-
69
-
 70
70 -
 71
71 -
 72
72 -
 73
73 -
 74
74 -
 75
75 -
 76
76 -
 77
77 -
 78
78 -
 79
79 -
 80
80 -
 81
81 -
 82
82 -
 83
83 -
 84
84 -
 85
85 -
 86
86 -
 87
87 -
 88
88 -
 89
89 -
 90
90 -
91
-
92
-
93
-
94
-
95
-
96
-
97
-
98
-
99
-
100
-
101
-
102
-
103
-
104
-
105
-
106
-
107
-
108
-
109
-
110
-
111
-
112
-
113
-
114
-
115
-
116
-
117
-
118
-
119
-
120
-
121
-
122
-
123
-
124
-
125
-
126
-
127
-
128
-
129
-
130
-
131
-
132
-
133
-
134
-
135
-
136
-
137
-
138
-
139
-
140
-
141
-
142
-
143
-
144
-
145
-
146
-
147
 |
 |

58
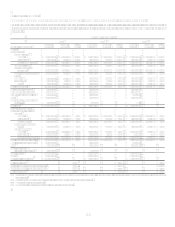
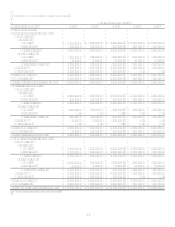
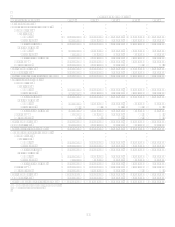
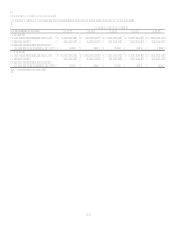
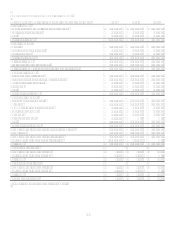
TABLE FNET CHARGE-OFFS
Table F shows the Companys net charge-offs for the periods presented on a reported and managed basis.
Year Ended December 31
(Dollars in thousands) 2007(1) 2006 2005 2004 2003
Reported:
Average loans held for investment $ 93,541,825 $ 63,577,279 $ 40,734,237 $ 34,265,668 $ 28,677,616
Net charge-offs 1,960,541 1,407,489 1,446,649 1,295,568 1,646,360
Net charge-offs as a percentage of
average loans held for investment 2.10% 2.21% 3.55% 3.78% 5.74%
Managed:
Average loans held for investment $ 144,727,007 $ 111,328,595 $ 85,265,023 $ 73,711,673 $ 62,911,953
Net charge-offs 4,161,995 3,158,080 3,623,154 3,251,761 3,683,887
Net charge-offs as a percentage of
average loans held for investment 2.88% 2.84% 4.25% 4.41% 5.86%
(1) Based on continuing operations.