Capital One 2007 Annual Report Download - page 61
Download and view the complete annual report
Please find page 61 of the 2007 Capital One annual report below. You can navigate through the pages in the report by either clicking on the pages listed below, or by using the keyword search tool below to find specific information within the annual report.-
 1
1 -
2
-
3
-
4
-
5
-
6
-
7
-
8
-
9
-
10
-
11
-
12
-
13
-
14
-
15
-
16
-
17
-
18
-
19
-
20
-
21
-
22
-
23
-
24
-
25
-
26
-
27
-
28
-
29
-
30
-
31
-
32
-
33
-
34
-
35
-
36
-
37
-
38
-
39
-
40
-
41
-
42
-
43
-
44
-
45
-
46
-
47
-
48
-
49
-
50
-
 51
51 -
 52
52 -
 53
53 -
 54
54 -
 55
55 -
 56
56 -
 57
57 -
 58
58 -
 59
59 -
 60
60 -
 61
61 -
 62
62 -
 63
63 -
 64
64 -
 65
65 -
 66
66 -
 67
67 -
 68
68 -
 69
69 -
 70
70 -
 71
71 -
72
-
73
-
74
-
75
-
76
-
77
-
78
-
79
-
80
-
81
-
82
-
83
-
84
-
85
-
86
-
87
-
88
-
89
-
90
-
91
-
92
-
93
-
94
-
95
-
96
-
97
-
98
-
99
-
100
-
101
-
102
-
103
-
104
-
105
-
106
-
107
-
108
-
109
-
110
-
111
-
112
-
113
-
114
-
115
-
116
-
117
-
118
-
119
-
120
-
121
-
122
-
123
-
124
-
125
-
126
-
127
-
128
-
129
-
130
-
131
-
132
-
133
-
134
-
135
-
136
-
137
-
138
-
139
-
140
-
141
-
142
-
143
-
144
-
145
-
146
-
147
 |
 |

39
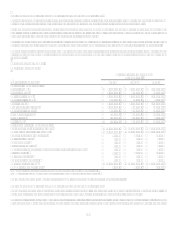
Local Banking Segment
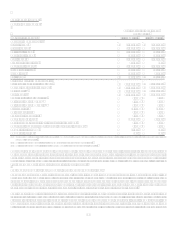
Table 2: Local Banking
As of and for the Year ended
December 31
(Dollars in thousands) 2007 2006
Earnings (Managed Basis)
Interest income $ 6,910,661 $ 2,773,973
Interest expense 4,587,833 1,777,044
Net interest income 2,322,828 996,929
Non-interest income 798,268 446,071
Total revenue 3,121,096 1,443,000
Provision for loan losses 32,085 399
Non-interest expense 2,208,262 1,167,873
Income before taxes 880,749 274,728
Income taxes 306,553 96,155
Net income $ 574,196 $ 178,573
Selected Metrics (Managed Basis)
Period end loans held for investment $ 43,972,795 $ 12,145,533
Average loans held for investment $ 42,272,403 $ 13,225,559
Core deposits(1) $ 63,206,923 $ 27,071,324
Total deposits $ 73,318,570 $ 35,334,610
Loans held for investment yield 7.04% 7.75%
Net interest marginloans(2) 1.86% 3.24%
Net interest margindeposits(3) 2.03% 1.56%
Efficiency ratio 70.75% 80.93%
Net charge-off rate 0.20% 0.43%
30+ day delinquency rate 0.76% 0.31%
Non performing loans 178,385 57,824
Non performing loans as a % of loans held for investment 0.41% 0.48%
Non-interest expense as a % of average loans held for investment 5.22% 8.83%
Number of active ATMs 1,288 661
Number of locations 742 358
(1) Includes domestic non-interest bearing deposits, NOW accounts, money market deposit accounts, savings accounts, certificates of deposit of less than $100,000 and other
consumer time deposits.
(2) Net interest marginloans is interest incomeloans divided by average managed loans.
(3) Net interest margindeposits is interest expensedeposits divided by average retail deposits.
Beginning in 2006, we added a Local Banking segment. The Local Banking segment represents the results of the legacy Hibernia and
North Fork business lines, except for the indirect auto business and the investment portfolio results, and our branchless deposit
business. The legacy indirect auto businesses of both Hibernia and North Fork are included in the Auto Finance sub-segment results,
and the respective investment portfolio results are included in the Other category. The impacts of the North Fork acquisition for the
year ended December 31, 2006 are included in the Other category.
Year Ended December 31, 2007 Compared to Year Ended December 31, 2006
The Local Banking segment contributed $574.2 million of net income to the Company during 2007, compared to $178.6 million
during 2006. At December 31, 2007, loans outstanding in the Local Banking segment totaled $44.0 billion while deposits outstanding
totaled $73.3 billion. The increases in loans and deposits outstanding are due primarily to the addition of the loan and deposit
portfolios of North Fork Bank, along with modest growth in loans and deposits during 2007. As of December 31, 2006, North Fork
loan and deposit balances of $30.1 billion and $37.8 billion, respectively, were included in the Other category.
Local Banking segment profits are primarily generated from net interest income, which represents the spread between loan yields and
the internal cost of funds charged to the business for those loans, plus the spread between deposit interest costs and the funds transfer
price credited to the business for those deposits. During 2007, the Local Banking segment generated net interest income of $2.3 billion
compared to $996.9 million during 2006. The increase is due to the increase in loan and deposit outstandings mentioned above. The
net interest margin on loans was lower in 2007 than 2006 because of the addition of the North Fork loan portfolio, which contained a