Capital One 2007 Annual Report Download - page 64
Download and view the complete annual report
Please find page 64 of the 2007 Capital One annual report below. You can navigate through the pages in the report by either clicking on the pages listed below, or by using the keyword search tool below to find specific information within the annual report.
42
Year Ended December 31, 2006 Compared to Year Ended December 31, 2005
U.S. Card sub-segment earnings increased year over year primarily due to the favorable credit environment. Throughout 2006, charge-
offs remained at historically low levels following the change in bankruptcy legislation in the fourth quarter of 2005.
Period end loans held for investment increased year over year by 8% and was driven by a combination of both new customer
acquisitions as well as growth and retention of balances from existing customers. Purchase volume growth of 13% shows continued
growth within the rewards business along with healthy retail sales growth.
Total revenues declined 2% for the year, primarily driven by changes in product strategy. In 2006, U.S. Card had increasingly focused
on transactor products, shifted more upmarket in subprime cards and modestly increased the volume of assets at introductory rates.
The provision for loan losses decreased 28% during 2006. The decrease is attributable to the favorable credit environment in 2006,
offset by loan growth. Non-interest expenses for 2006 increased 5%, primarily driven by infrastructure improvements and
investments.
Auto Finance Sub-Segment
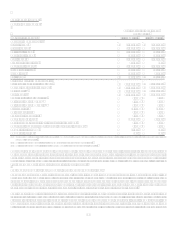
Table 5: Auto Finance
As of and for the Year Ended
December 31,
(Dollars in thousands) 2007 2006(2) 2005
Earnings (Managed Basis)
Interest income $ 2,638,290 $ 2,237,205 $ 1,657,505
Interest expense 1,127,421 864,688 508,128
Net interest income 1,510,869 1,372,517 1,149,377
Non-interest income 112,261 81,384 19,951
Total revenue 1,623,130 1,453,901 1,169,328
Provision for loan losses 1,056,120 494,835 459,513
Non-interest expense 618,568 599,807 506,480
Income before taxes (51,558) 359,259 203,335
Income taxes (17,736) 125,740 71,268
Net income $ (33,822) $ 233,519 $ 132,067
Selected Metrics (Managed Basis)
Period end loans held for investment $ 25,128,352 $ 21,751,827 $ 16,372,019
Average loans held for investment $ 24,150,231 $ 20,490,920 $ 14,177,631
Loans held for investment yield 10.92% 10.92% 11.69%
Net interest margin 6.26% 6.70% 8.11%
Revenue margin 6.72% 7.10% 8.25%
Risk adjusted margin 3.66% 4.82% 5.55%
Non-interest expense as a % of average loans held for investment 2.56% 2.93% 3.57%
Efficiency ratio 38.11% 41.25% 43.31%
Net charge-off rate 3.06% 2.28% 2.70%
30+ day delinquency rate 7.84% 6.35% 5.71%
Auto loan originations(1) $ 13,176,533 $ 12,285,307 $ 10,447,600
Number of Accounts (000s) 1,771 1,589 1,217
(1) Includes all organic auto loan originations and excludes auto loans added through acquisitions.
(2) Certain prior period amounts have been reclassified to conform with current period presentation.
The Auto Finance sub-segment consists of automobile and other motor vehicle financing activities.
Year Ended December 31, 2007 Compared to Year Ended December 31, 2006
The Auto Finance sub-segment recognized a net loss of $33.8 million during 2007, compared with net income of $233.5 million
during 2006, as revenue generated from portfolio growth was more than offset by worsening credit performance.
The loan portfolio increased 16% year over year as a result of the transfer of $1.8 billion of North Fork Banks auto loans to the Auto
Finance sub-segment on January 1, 2007 and strong organic originations growth within our dealer and direct marketing channels.


