Capital One 2007 Annual Report Download - page 66
Download and view the complete annual report
Please find page 66 of the 2007 Capital One annual report below. You can navigate through the pages in the report by either clicking on the pages listed below, or by using the keyword search tool below to find specific information within the annual report.-
 1
1 -
2
-
3
-
4
-
5
-
6
-
7
-
8
-
9
-
10
-
11
-
12
-
13
-
14
-
15
-
16
-
17
-
18
-
19
-
20
-
21
-
22
-
23
-
24
-
25
-
26
-
27
-
28
-
29
-
30
-
31
-
32
-
33
-
34
-
35
-
36
-
37
-
38
-
39
-
40
-
41
-
42
-
43
-
44
-
45
-
46
-
47
-
48
-
49
-
50
-
51
-
52
-
53
-
54
-
55
-
 56
56 -
 57
57 -
 58
58 -
 59
59 -
 60
60 -
 61
61 -
 62
62 -
 63
63 -
 64
64 -
 65
65 -
 66
66 -
 67
67 -
 68
68 -
 69
69 -
 70
70 -
 71
71 -
 72
72 -
 73
73 -
 74
74 -
 75
75 -
 76
76 -
77
-
78
-
79
-
80
-
81
-
82
-
83
-
84
-
85
-
86
-
87
-
88
-
89
-
90
-
91
-
92
-
93
-
94
-
95
-
96
-
97
-
98
-
99
-
100
-
101
-
102
-
103
-
104
-
105
-
106
-
107
-
108
-
109
-
110
-
111
-
112
-
113
-
114
-
115
-
116
-
117
-
118
-
119
-
120
-
121
-
122
-
123
-
124
-
125
-
126
-
127
-
128
-
129
-
130
-
131
-
132
-
133
-
134
-
135
-
136
-
137
-
138
-
139
-
140
-
141
-
142
-
143
-
144
-
145
-
146
-
147
 |
 |

44
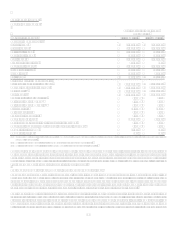
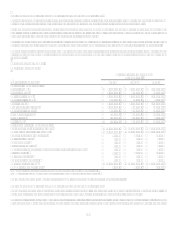
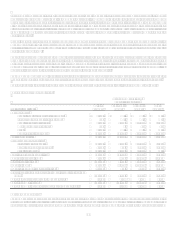
Global Financial Services Sub-Segment
Table 6: Global Financial Services
As of and for the Year Ended
December 31,
(Dollars in thousands) 2007 2006 2005
Earnings (Managed Basis)
Interest income $ 3,458,351 $ 2,979,164 $ 2,619,251
Interest expense 1,356,942 1,161,293 938,729
Net interest income 2,101,409 1,817,871 1,680,522
Non-interest income 1,256,479 1,187,087 1,022,756
Total revenue 3,357,888 3,004,958 2,703,278
Provision for loan losses 1,283,693 1,068,395 925,777
Non-interest expense 1,619,754 1,509,666 1,496,678
Income before taxes 454,441 426,897 280,823
Income taxes 155,066 152,945 94,796
Net income $ 299,375 $ 273,952 $ 186,027
Selected Metrics (Managed Basis)
Period end loans held for investment $ 29,301,244 $ 26,983,673 $ 23,386,490
Average loans held for investment $ 27,738,553 $ 25,421,248 $ 22,212,680
Loans held for investment yield 12.37% 11.65% 11.76%
Net interest margin 7.58% 7.15% 7.57%
Revenue margin 12.11% 11.82% 12.17%
Risk adjusted margin 8.02% 8.04% 8.20%
Non-interest expense as a % of average loans held for investment 5.84% 5.94% 6.74%
Efficiency ratio 48.24% 50.24% 55.37%
Net charge-off rate 4.09% 3.78% 3.97%
30+ day delinquency rate 3.29% 2.97% 2.83%
Number of Accounts (000s) 10,316 10,155 9,928
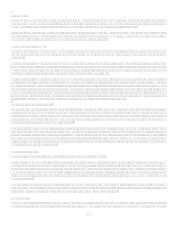
The Global Financial Services sub-segment consists of international (U.K. and Canada) lending, small business lending, installment
loans, home loans, healthcare finance and other consumer financial service activities, extending Capital Ones national scale lending
franchise and providing geographic diversification.
Year Ended December 31, 2007 Compared to Year Ended December 31, 2006
Net income for the Global Financial Services sub-segment increased 9% during 2007. Excluding the $31.3 million net gain on the sale
of Spain, net income increased 1% from 2006. Profitability improved year-over-year in the U.K. due primarily to an improved credit
outlook, however, domestic businesses are facing more challenges due to worsening customer credit outlook in the U.S.
Revenue growth in 2007, excluding the Spain gain on sale, was 10% and was in line with growth in average loans of 9%. Non-interest
expense grew more modestly at 7%, resulting in improvement in the efficiency ratio from 50% in 2006 to 48% in 2007.
The provision for loan losses increased 20% during 2007, as a result of growth in the loan portfolio combined with deteriorating credit
quality metrics in U.S. Global Financial Services. The net charge-off rate for 2007 was 4.09%, an increase of 31 basis points
compared to 3.78% for 2006. The increase in the net charge-off rate is largely the result of worsening U.S. credit quality trends, offset
by recovery in the U.K.
Year Ended December 31, 2006 Compared to Year Ended December 31, 2005
Net income for the Global Financial Services sub-segment increased 47% during 2006 as a result of strong growth and profitability
across all North American businesses. Strong 2006 growth in North America was offset by challenges in Europe. Total revenue
increased 11% during 2006, slightly below the 14% growth in average loans outstanding for the same period.
The provision for loan losses increased 15% during 2006, as a result of growth in the loan portfolio combined with deteriorating credit
quality metrics in the U.K. The net charge-off rate for 2006 was 3.78%, a decline of 19 basis points compared to 3.97 for 2005. The
decrease in the net charge-off rate is largely the result of the 2005 U.S. bankruptcy legislation changes and continued stability in North
American credit quality trends, offset by continued worsening in the U.K.