Capital One 2007 Annual Report Download - page 131
Download and view the complete annual report
Please find page 131 of the 2007 Capital One annual report below. You can navigate through the pages in the report by either clicking on the pages listed below, or by using the keyword search tool below to find specific information within the annual report.-
 1
1 -
2
-
3
-
4
-
5
-
6
-
7
-
8
-
9
-
10
-
11
-
12
-
13
-
14
-
15
-
16
-
17
-
18
-
19
-
20
-
21
-
22
-
23
-
24
-
25
-
26
-
27
-
28
-
29
-
30
-
31
-
32
-
33
-
34
-
35
-
36
-
37
-
38
-
39
-
40
-
41
-
42
-
43
-
44
-
45
-
46
-
47
-
48
-
49
-
50
-
51
-
52
-
53
-
54
-
55
-
56
-
57
-
58
-
59
-
60
-
61
-
62
-
63
-
64
-
65
-
66
-
67
-
68
-
69
-
70
-
71
-
72
-
73
-
74
-
75
-
76
-
77
-
78
-
79
-
80
-
81
-
82
-
83
-
84
-
85
-
86
-
87
-
88
-
89
-
90
-
91
-
92
-
93
-
94
-
95
-
96
-
97
-
98
-
99
-
100
-
101
-
102
-
103
-
104
-
105
-
106
-
107
-
108
-
109
-
110
-
111
-
112
-
113
-
114
-
115
-
116
-
117
-
118
-
119
-
120
-
 121
121 -
 122
122 -
 123
123 -
 124
124 -
 125
125 -
 126
126 -
 127
127 -
 128
128 -
 129
129 -
 130
130 -
 131
131 -
 132
132 -
 133
133 -
 134
134 -
 135
135 -
 136
136 -
 137
137 -
 138
138 -
 139
139 -
 140
140 -
 141
141 -
142
-
143
-
144
-
145
-
146
-
147
 |
 |

109
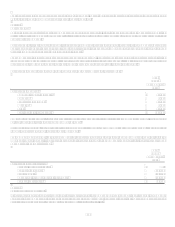
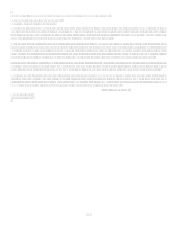
Note 28
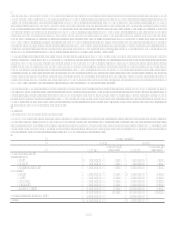
International Activities
The Companys international activities are primarily performed through Capital One Bank (Europe) plc, a subsidiary bank of COB
that provides consumer lending and other financial products in Europe and Capital One BankCanada Branch, a foreign branch
office of COB that provides consumer lending products in Canada. The total assets, revenue, income before income taxes and net
income of the international operations are summarized below.
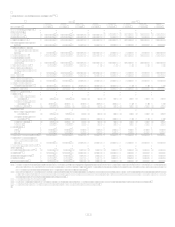
Z
2007 2006(2) 2005(2)
Domestic
Total Assets $ 145,033,862 $ 145,056,455 $ 83,447,512
Revenue(1) 13,322,220 10,970,257 8,844,328
Income from continuing operations before income taxes 3,686,462 3,618,268 2,666,491
Income from continuing operations, net of tax 2,465,718 2,391,205 1,674,061
Loss from discontinued operations, net of tax (1,021,387) (11,884)
Net Income 1,444,331 2,379,321 1,674,061
International
Total Assets 5,556,507 4,682,830 5,253,899
Revenue(1) 1,261,848 1,122,213 1,194,019
Income before income taxes 183,094 54,073 162,511
Net Income 126,001 35,172 135,086
Total Company
Total Assets $ 150,590,369 $ 149,739,285 $ 88,701,411
Revenue(1) 14,584,068 12,092,470 10,038,347
Income from continuing operations before income taxes 3,869,556 3,672,341 2,829,002
Income from continuing operations, net of tax 2,591,719 2,426,377 1,809,147
Loss from discontinued operations, net of tax (1,021,387) (11,884)
Net Income 1,570,332 2,414,493 1,809,147
(1) Revenue is net interest income plus non-interest income.
(2) Certain prior period amounts have been reclassified to conform with current period presentation.
The Company maintains its books and records on a legal entity basis for the preparation of financial statements in conformity with
GAAP. Because certain international operations are integrated with many of the Companys domestic operations, estimates and
assumptions have been made to assign certain expense items between domestic and foreign operations.
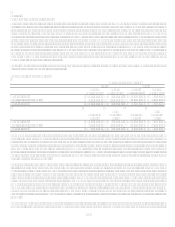
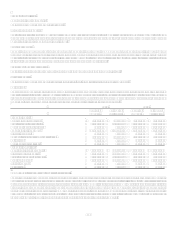
Note 29
Capital One Financial Corporation (Parent Company Only)
Condensed Financial Information
The following Parent Company Only financial statements are provided in accordance with Regulation S-X of the Securities and
Exchange Commission which requires all issuers or guarantors of registered securities to include separate annual financial statements.
December 31
Balance Sheets 2007 2006
Assets:
Cash and cash equivalents $ 24,702
$ 239,473
Investment in subsidiaries 26,916,546
28,131,614
Loans to subsidiaries(1) 6,604,075
4,673,409
Other 582,717
353,862
Total assets $ 34,128,040 $ 33,398,358
Liabilities:
Senior and subordinated notes $ 7,187,007
$ 6,205,821
Borrowings from subsidiaries 275,639
1,754,419
Other borrowings(2) 1,645,656
Other 725,626
202,912
Total liabilities 9,833,928
8,163,152
Stockholders equity 24,294,112
25,235,206
Total liabilities and stockholders equity $ 34,128,040 $ 33,398,358
(1) As of December 31, 2007 and 2006, includes $2.3 billion and $2.7 billion, respectively, of cash invested at COB instead of the open market.