Capital One 2007 Annual Report Download - page 137
Download and view the complete annual report
Please find page 137 of the 2007 Capital One annual report below. You can navigate through the pages in the report by either clicking on the pages listed below, or by using the keyword search tool below to find specific information within the annual report.-
 1
1 -
2
-
3
-
4
-
5
-
6
-
7
-
8
-
9
-
10
-
11
-
12
-
13
-
14
-
15
-
16
-
17
-
18
-
19
-
20
-
21
-
22
-
23
-
24
-
25
-
26
-
27
-
28
-
29
-
30
-
31
-
32
-
33
-
34
-
35
-
36
-
37
-
38
-
39
-
40
-
41
-
42
-
43
-
44
-
45
-
46
-
47
-
48
-
49
-
50
-
51
-
52
-
53
-
54
-
55
-
56
-
57
-
58
-
59
-
60
-
61
-
62
-
63
-
64
-
65
-
66
-
67
-
68
-
69
-
70
-
71
-
72
-
73
-
74
-
75
-
76
-
77
-
78
-
79
-
80
-
81
-
82
-
83
-
84
-
85
-
86
-
87
-
88
-
89
-
90
-
91
-
92
-
93
-
94
-
95
-
96
-
97
-
98
-
99
-
100
-
101
-
102
-
103
-
104
-
105
-
106
-
107
-
108
-
109
-
110
-
111
-
112
-
113
-
114
-
115
-
116
-
117
-
118
-
119
-
120
-
121
-
122
-
123
-
124
-
125
-
126
-
 127
127 -
 128
128 -
 129
129 -
 130
130 -
 131
131 -
 132
132 -
 133
133 -
 134
134 -
 135
135 -
 136
136 -
 137
137 -
 138
138 -
 139
139 -
 140
140 -
 141
141 -
 142
142 -
 143
143 -
 144
144 -
 145
145 -
 146
146 -
 147
147
 |
 |

115
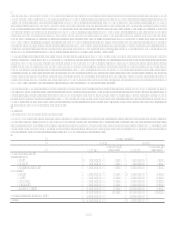
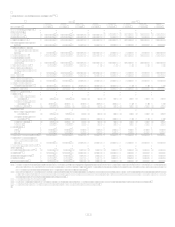
Selected Quarterly Financial Data(1)
2007 2006(5)
(Unaudited) Fourth
Quarter Third
Quarter Second
Quarter First
Quarter Fourth(4)
Quarter Third
Quarter Second
Quarter First
Quarter
Summary of Operations:
(In Thousands)
Interest income $ 2,960,194 $ 2,766,967 $ 2,638,686 $ 2,712,309
$ 2,323,925 $ 2,065,071 $ 1,897,157 $ 1,878,582
Interest expense 1,197,947 1,142,493 1,100,105 1,107,766
930,953 770,556 700,075 671,705
Net interest income 1,762,247 1,624,474 1,538,581 1,604,543
1,392,972 1,294,515 1,197,082 1,206,877
Provision for loan and lease
losses 1,294,210 595,534 396,713 350,045
513,157 430,566 362,445 170,270
Net interest income after
p
rovision for loan and lease
losses 468,037 1,028,940 1,141,868 1,254,498
879,815 863,949 834,637 1,036,607
Non-interest income 2,158,340 2,149,662 1,971,851 1,774,370
1,671,475 1,761,385 1,709,913 1,858,251
Non-interest expense,
excluding restructuring
expenses 2,107,398 1,914,867 1,943,461 1,974,047
1,962,686 1,726,629 1,680,897 1,573,479
Restructuring expenses 27,809 19,354 91,074
Income from continuing
operations before income
taxes 491,170 1,244,381 1,079,184 1,054,821
588,604 898,705 863,653 1,321,379
Income taxes 169,558 428,010 311,572 368,697
185,992 310,866 311,066 438,040
Income from continuing
operations, net of tax 321,612 816,371 767,612 686,124
402,612 587,839 552,587 883,339
Loss from discontinued
operations, net of tax(2) (95,044) (898,029) (17,240) (11,074) (11,884)
Net income (loss) $ 226,568 $ (81,658) $ 750,372 $ 675,050
$ 390,728 $ 587,839 $ 552,587 $ 883,339
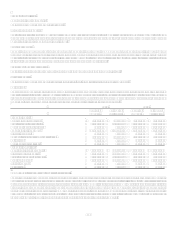
Per Common Share:
Basic EPS:
Income from continuing
operations $ 0.85 $ 2.11 $ 1.96 $ 1.68
$ 1.20 $ 1.95 $ 1.84 $ 2.95
Loss from discontinued
operations(2) (0.25) (2.32) (0.04) (0.03) (0.04)
Net Income (loss) $ 0.60 $ (0.21) $ 1.92 $ 1.65
$ 1.16 $ 1.95 $ 1.84 $ 2.95
Diluted EPS:
Income from continuing
operations $ 0.85 $ 2.09 $ 1.93 $ 1.65
$ 1.17 $ 1.89 $ 1.78 $ 2.86
Loss from discontinued
operations(2) (0.25) (2.30) (0.04) (0.03) (0.03)
Net Income (loss) $ 0.60 $ (0.21) $ 1.89 $ 1.62
$ 1.14 $ 1.89 $ 1.78 $ 2.86
Dividends 0.03 0.03 0.03 0.03
0.03 0.03 0.03 0.03
Market prices
High 72.94 78.94 81.85 83.61
82.72 86.17 87.23 89.92
Low 45.66 62.70 70.26 74.37
74.97 69.88 81.10 80.52
Average common shares (000s) 375,566 386,133 390,847 408,709
336,470 301,571 300,829 299,257
Average common shares and
common equivalent shares
(000s) 378,439 390,844 397,473 415,530
343,779 310,386 309,988 309,121
Average Balance Sheet Data:
(In Millions)
Loans held for investment(3) $ 97,785 $ 91,745 $ 91,145 $ 93,466
$ 74,738 $ 62,429 $ 58,833 $ 58,142
Total assets(3) 150,926 143,291 142,690 143,130
111,440 92,295 89,644 88,895
Interest-bearing deposits 72,312 73,555 75,218 74,867
53,735 42,984 42,797 43,357
Total deposits 84,051 84,884 86,719 86,237
60,382 47,196 47,209 47,870
Stockholders equity $ 24,733 $ 25,344 $ 25,128 $ 25,610
$ 18,311 $ 16,310 $ 15,581 $ 14,612
(1) The above schedule is a tabulation of the Companys unaudited quarterly results for the years ended December 31, 2007 and 2006. The Companys common shares are
traded on the New York Stock Exchange under the symbol COF. In addition, shares may be traded in the over-the-counter stock market. There were 18,487 and 19,763
common stockholders of record as of December 31, 2007 and 2006, respectively.
(2) In Q3 2007, the Company shut down the mortgage origination operations of its wholesale mortgage banking unit, GreenPoint Mortgage, realizing an after-tax loss of $898.0
million. The results of the mortgage origination operation of GreenPoint have been accounted for as a discontinued operation and have been removed from the Companys
results of continuing operations for all periods presented.
(3) Based on continuing operations.
(4) On December 1, 2006, the Company acquired 100% of the outstanding common stock of North Fork Bancorporation for total consideration of $13.2 billion.
(5) Certain prior period amounts have been reclassified to conform with current period presentation.