Capital One 2007 Annual Report Download - page 21
Download and view the complete annual report
Please find page 21 of the 2007 Capital One annual report below. You can navigate through the pages in the report by either clicking on the pages listed below, or by using the keyword search tool below to find specific information within the annual report.-
 1
1 -
2
-
3
-
4
-
5
-
6
-
7
-
8
-
9
-
10
-
 11
11 -
 12
12 -
 13
13 -
 14
14 -
 15
15 -
 16
16 -
 17
17 -
 18
18 -
 19
19 -
 20
20 -
 21
21 -
 22
22 -
 23
23 -
 24
24 -
 25
25 -
 26
26 -
 27
27 -
 28
28 -
 29
29 -
 30
30 -
 31
31 -
32
-
33
-
34
-
35
-
36
-
37
-
38
-
39
-
40
-
41
-
42
-
43
-
44
-
45
-
46
-
47
-
48
-
49
-
50
-
51
-
52
-
53
-
54
-
55
-
56
-
57
-
58
-
59
-
60
-
61
-
62
-
63
-
64
-
65
-
66
-
67
-
68
-
69
-
70
-
71
-
72
-
73
-
74
-
75
-
76
-
77
-
78
-
79
-
80
-
81
-
82
-
83
-
84
-
85
-
86
-
87
-
88
-
89
-
90
-
91
-
92
-
93
-
94
-
95
-
96
-
97
-
98
-
99
-
100
-
101
-
102
-
103
-
104
-
105
-
106
-
107
-
108
-
109
-
110
-
111
-
112
-
113
-
114
-
115
-
116
-
117
-
118
-
119
-
120
-
121
-
122
-
123
-
124
-
125
-
126
-
127
-
128
-
129
-
130
-
131
-
132
-
133
-
134
-
135
-
136
-
137
-
138
-
139
-
140
-
141
-
142
-
143
-
144
-
145
-
146
-
147
 |
 |

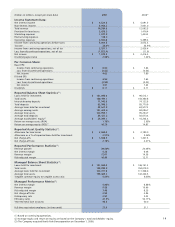
19
(Dollars in millions, except per share data) 2007 2006(3)
Income Statement Data:
Net interest income $ 6,529.8 $ 5,091.5
Non-interest income 8,054.2 7,001.0
Total revenue 14,584.0 12,092.5
Provision for loan losses 2,636.5 1,476.4
Marketing expenses 1,347.8 1,444.3
Restructuring expenses 138.2 —
Operating expenses 6,592.0 5,499.4
Income from continuing operations before taxes 3,869.5 3,672.4
Tax rate 33.0% 33.9%
Income from continuing operations, net of tax 2,591.7 2,426.4
Loss from discontinued operations, net of tax (1,021.4) (11.9)
Net income $ 1,570.3 $ 2,414.5
Dividend payout ratio 2.68% 1.34%
Per Common Share:
Basic EPS:
Income from continuing operations $ 6.64 $ 7.84
Loss from discontinued operations (2.62) (0.04)
Net income 4.02 7.80
Diluted EPS:
Income from continuing operations 6.55 7.65
Loss from discontinued operations (2.58) (0.03)
Net income 3.97 7.62
Dividends $ 0.11 $ 0.11
Reported Balance Sheet Statistics(1):
Loans held for investment $ 101,805.0 $ 96,512.1
Total assets 150,499.1 144,360.8
Interest-bearing deposits 71,943.9 74,122.8
Total deposits 82,990.5 85,770.9
Average loans held for investment 93,541.8 63,577.3
Average earning assets 121,420.4 84,086.7
Average total assets 144,999.1 95,254.7
Average total deposits 85,427.2 50,673.4
Average stockholders’ equity(2) $ 25,203.1 $ 16,203.4
Return on average assets (ROA) 1.79% 2.55%
Return on average equity (ROE)(2) 10.28 14.97
Reported Asset Quality Statistics(1):
Allowance for loan losses $ 2,963.0 $ 2,180.0
Allowance as a % of reported loans held for investment 2.91% 2.26%
Net charge-offs $ 1,960.5 $ 1,407.5
Net charge-off rate 2.10% 2.21%
Reported Performance Statistics(1):
Revenue growth 20.60% 20.46%
Net interest margin 5.38 6.06
Revenue margin 12.01 14.38
Risk-adjusted margin 10.40 12.71
Managed Balance Sheet Statistics(1):
Loans held for investment $ 151,362.4 $ 146,151.3
Total assets 199,205.8 194,019.0
Average loans held for investment 144,727.0 111,328.6
Average total assets 195,409.2 142,426.5
Tangible common equity to tangible assets ratio 5.83% 6.38%
Managed Performance Metrics(1):
Net interest margin 6.46% 6.88%
Revenue margin 9.85 10.66
Risk-adjusted margin 7.40 8.23
Net charge-off rate 2.88 2.84
Delinquency rate 3.87 3.02
Efficiency ratio 47.3% 50.17%
Year-end total loan accounts 48.5 50.0
Full-time equivalent employees (in thousands) 27.0 31.1
(1) Based on continuing operations.
(2) Average equity and return on equity are based on the Company’s total stockholders’ equity.
(3) The Company acquired North Fork Bancorporation on December 1, 2006.