Capital One 2007 Annual Report Download - page 59
Download and view the complete annual report
Please find page 59 of the 2007 Capital One annual report below. You can navigate through the pages in the report by either clicking on the pages listed below, or by using the keyword search tool below to find specific information within the annual report.-
 1
1 -
2
-
3
-
4
-
5
-
6
-
7
-
8
-
9
-
10
-
11
-
12
-
13
-
14
-
15
-
16
-
17
-
18
-
19
-
20
-
21
-
22
-
23
-
24
-
25
-
26
-
27
-
28
-
29
-
30
-
31
-
32
-
33
-
34
-
35
-
36
-
37
-
38
-
39
-
40
-
41
-
42
-
43
-
44
-
45
-
46
-
47
-
48
-
 49
49 -
 50
50 -
 51
51 -
 52
52 -
 53
53 -
 54
54 -
 55
55 -
 56
56 -
 57
57 -
 58
58 -
 59
59 -
 60
60 -
 61
61 -
 62
62 -
 63
63 -
 64
64 -
 65
65 -
 66
66 -
 67
67 -
 68
68 -
 69
69 -
70
-
71
-
72
-
73
-
74
-
75
-
76
-
77
-
78
-
79
-
80
-
81
-
82
-
83
-
84
-
85
-
86
-
87
-
88
-
89
-
90
-
91
-
92
-
93
-
94
-
95
-
96
-
97
-
98
-
99
-
100
-
101
-
102
-
103
-
104
-
105
-
106
-
107
-
108
-
109
-
110
-
111
-
112
-
113
-
114
-
115
-
116
-
117
-
118
-
119
-
120
-
121
-
122
-
123
-
124
-
125
-
126
-
127
-
128
-
129
-
130
-
131
-
132
-
133
-
134
-
135
-
136
-
137
-
138
-
139
-
140
-
141
-
142
-
143
-
144
-
145
-
146
-
147
 |
 |
37
was primarily due to changes in the Companys international tax position recognized in the second quarter 2007 in the amount of
$69.0 million and increases in certain tax credits. The decrease in the 2006 rate compared to 2005 was primarily due to the resolution
of certain tax issues and audits for prior years with the Internal Revenue Service resulting in $70.7 million reduction to 2006 income
tax expense.
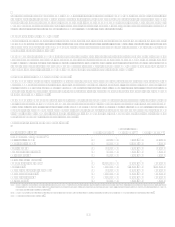
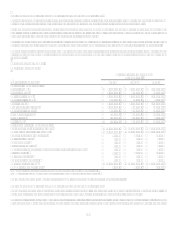
Loan Portfolio Summary
The Company analyzes its financial performance on a managed loan portfolio basis. The managed loan portfolio is comprised of on-
balance sheet and off-balance sheet loans. The Company has retained servicing rights for its securitized loans and receives servicing
fees in addition to the excess spread generated from the off-balance sheet loan portfolio.
Average managed loans held for investment from continuing operations grew $33.4 billion, or 30%, and $26.1 billion, or 31%, for the
year ended December 31, 2007 and December 31, 2006, respectively. The increases in average managed loans held for investment
were driven by loan growth in the Local Banking segment as a result of the North Fork acquisition in 2006 and the Hibernia
acquisition in 2005.
For additional information, see section XII, Tabular Summary, Table C (Managed Loan Portfolio) and Table D (Composition of
Reported Loan Portfolio).
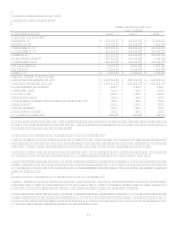
Asset Quality
Delinquencies
The Company believes delinquencies to be an indicator of loan portfolio credit quality at a point in time.
The 30-plus day delinquency rate for the reported and managed consumer loan portfolio increased 92 and 85 basis points to 3.66% and
3.87%, respectively, from December 31, 2006 to December 31, 2007. The acquisition of the lower loss North Fork loan portfolio
reduced reported and managed delinquency rates. The decrease was offset by normalization of credit following the unusually
favorable credit environment in 2006, selective pricing and fee policy moves in the U.S. Card sub-segment, the significant pull back
from prime revolver marketing in the U.S. Card sub-segment, continued elevated losses in the Auto Finance sub-segment, and from
economic weakening evidenced by increased delinquencies and consistent with recently released economic indicators.
The 30-plus day delinquency rate for the reported and managed consumer loan portfolio decreased 40 and 22 basis points to 2.74%
and 3.02%, respectively, at December 31, 2006, compared to December 31, 2005. The reduction in the reported and managed
consumer loan 30-plus day delinquency rates reflect a higher concentration of lower loss assets in the respective loan portfolios
(including $31.7 billion loans added through the acquisition of North Fork).
For additional information, see section XII, Tabular Summary, Table E (Delinquencies).
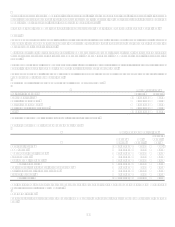
Net Charge-Offs
Net charge-offs include the principal amount of losses (excluding accrued and unpaid finance charges and fees and fraud losses) less
current period principal recoveries. We charge off credit card loans at 180 days past the statement cycle date and generally charge off
other consumer loans at 120 days past the due date or upon repossession of collateral. Bankruptcies charge-off within 30 days of
notification and deceased accounts charge-off within 60 days of notification. Commercial loans are charged-off when the amounts are
deemed uncollectible. Costs to recover previously charged-off accounts are recorded as collection expenses in other non-interest
expense.
Year-to-date 2007 reported and managed net charge-off rates decreased 11 basis points to 2.10% and increased 4 basis points to
2.88%, respectively. The decrease in the reported charge-off rate was impacted by the higher credit quality North Fork loan portfolio
for a full year 2007 which more than offset the effects of continued consumer credit normalization and economic weakness during the
latter part of 2007. The impacts of the continued credit normalization and economic weakness also had a significant impact on the
managed charge-off rate for the Companys credit card securitization programs. Year-to-date reported and managed net charge-off
dollars increased 39% and 32%, respectively, compared to the prior year.
Year-to-date 2006 reported and managed net charge-off rates decreased 134 and 141 basis points, respectively, with net charge-off
dollars decreasing 3% and 13% on a reported and managed basis, respectively, for the year ended December 31, 2006 compared to the
prior year. The decrease in net charge-off rates was due to historically low levels of bankruptcies following the change in bankruptcy
legislation in the fourth quarter of 2005 and an increase in the concentration of higher credit quality loans in the reported loan portfolio
driven by acquisitions.
For additional information, see section XII, Tabular Summary, Table F (Net Charge-offs).