Capital One 2007 Annual Report Download - page 107
Download and view the complete annual report
Please find page 107 of the 2007 Capital One annual report below. You can navigate through the pages in the report by either clicking on the pages listed below, or by using the keyword search tool below to find specific information within the annual report.-
 1
1 -
2
-
3
-
4
-
5
-
6
-
7
-
8
-
9
-
10
-
11
-
12
-
13
-
14
-
15
-
16
-
17
-
18
-
19
-
20
-
21
-
22
-
23
-
24
-
25
-
26
-
27
-
28
-
29
-
30
-
31
-
32
-
33
-
34
-
35
-
36
-
37
-
38
-
39
-
40
-
41
-
42
-
43
-
44
-
45
-
46
-
47
-
48
-
49
-
50
-
51
-
52
-
53
-
54
-
55
-
56
-
57
-
58
-
59
-
60
-
61
-
62
-
63
-
64
-
65
-
66
-
67
-
68
-
69
-
70
-
71
-
72
-
73
-
74
-
75
-
76
-
77
-
78
-
79
-
80
-
81
-
82
-
83
-
84
-
85
-
86
-
87
-
88
-
89
-
90
-
91
-
92
-
93
-
94
-
95
-
96
-
 97
97 -
 98
98 -
 99
99 -
 100
100 -
 101
101 -
 102
102 -
 103
103 -
 104
104 -
 105
105 -
 106
106 -
 107
107 -
 108
108 -
 109
109 -
 110
110 -
 111
111 -
 112
112 -
 113
113 -
 114
114 -
 115
115 -
 116
116 -
 117
117 -
118
-
119
-
120
-
121
-
122
-
123
-
124
-
125
-
126
-
127
-
128
-
129
-
130
-
131
-
132
-
133
-
134
-
135
-
136
-
137
-
138
-
139
-
140
-
141
-
142
-
143
-
144
-
145
-
146
-
147
 |
 |

85
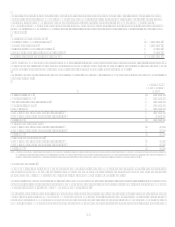
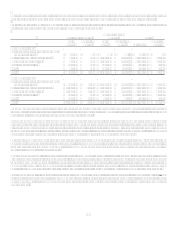
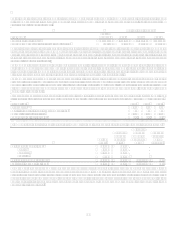
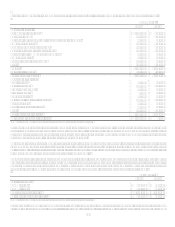
The following table provides the number of reserved common shares and the number of common shares available for future issuance
for the Companys active stock-based compensation plans as of December 31, 2007, 2006 and 2005. The ability to issue grants from
other plans was terminated in 2004.
Available For Issuance
Plan Name
Shares
Reserved 2007 2006 2005
2004 Stock Incentive Plan 20,000,000 7,862,529 12,287,294 4,313,190
1999 Non-Employee Directors Stock Incentive Plan 825,000 98,121 134,600 166,500
Generally the exercise price of stock options, or value of restricted stock awards, will equal the fair market value of the Companys
stock on the date of grant. The maximum contractual term for options is ten years, and option vesting is determined at the time of
grant. The vesting for most options is 33 1/3 percent per year beginning with the first anniversary of the grant date. For restricted stock,
the vesting is usually 25 percent on the first and second anniversaries of the grant date and 50 percent on the third anniversary date or
three years from the date of grant.
The Company also issues cash equity units which are recorded as liabilities as expense is recognized. Cash equity units are not issued
out of the Companys stock-based compensation plans because they are settled with a cash payment for each unit vested equal to the
fair market value of the Companys stock on the vesting date. Cash equity units vest 25 percent on the first and second anniversaries
of the grant date and 50 percent on the third anniversary date or three years from the date of grant.
The Company recognizes compensation expense on a straight line basis over the entire awards vesting period for any awards with
graded vesting. Total compensation expense recognized for share based compensation during the years 2007, 2006 and 2005 was
$230.0 million, $211.1 million and $154.5 million, respectively. The total income tax benefit recognized in the consolidated statement
of income for share based compensation arrangements during the years 2007, 2006 and 2005 was $80.5 million, $73.9 million and
$54.1 million, respectively.
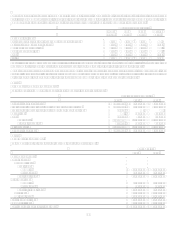
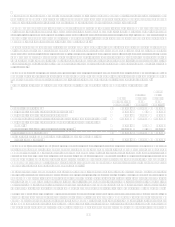
Stock option expense is based on per option fair values, estimated at the grant date using a Black-Scholes option-pricing model. The
fair value of options granted during 2007, 2006 and 2005 was estimated using the weighted average assumptions summarized below:
Assumptions 2007 2006 2005
Dividend yield (1) 1.53% .13% .14%
Volatility factors of stocks expected market price 27% 29% 46%
Average risk-free interest rate 4.05% 4.68% 4.26%
Expected option lives (in years) 4.5 4.5 5.3
(1) In 2007, the Company announced an expected dividend of approximately 25% of net income for 2008. Previously, the Company paid dividends at the rate of $0.11 per share.
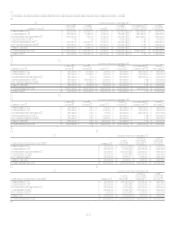
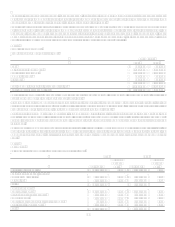
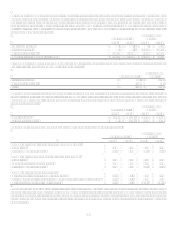
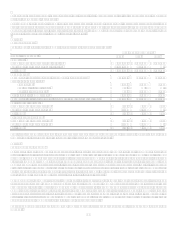
A summary of option activity under the plans as of December 31, 2007, and changes during the year then ended is presented below:
Options
(000s)
Weighted-
Average
Exercise
Price
Weighted-
Average
Remaining
Contractual
Term
Aggregate
Intrinsic
Value
(000,000)
Outstanding January 1, 2007 28,112 $ 55.77
Granted 3,580 64.73
Exercised (5,207) 43.03
Cancelled (981) 75.97
Outstanding December 31, 2007 25,504 $ 58.90 4.8 years $ 41.1
Exercisable December 31, 2007 16,897 $ 53.65 3.7 years $ 41.1
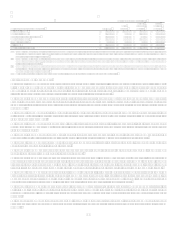
At December 31, 2007, the number, weighted average exercise price, aggregate intrinsic value and weighted average remaining
contractual terms of options vested and expected to vest approximate amounts for options outstanding. The weighted-average fair
value of options granted during the years 2007, 2006 and 2005 was $16.31, $26.94 and $37.07, respectively. Cash proceeds from the
exercise of stock options were $224.1 million for 2007. Tax benefits realized from the exercise of stock options were $61.0 million for
2007. The total intrinsic value of options exercised during the years 2007, 2006 and 2005 was $174.4 million, $143.1 million, and
$502.0 million, respectively.