Capital One 2007 Annual Report Download - page 56
Download and view the complete annual report
Please find page 56 of the 2007 Capital One annual report below. You can navigate through the pages in the report by either clicking on the pages listed below, or by using the keyword search tool below to find specific information within the annual report.-
 1
1 -
2
-
3
-
4
-
5
-
6
-
7
-
8
-
9
-
10
-
11
-
12
-
13
-
14
-
15
-
16
-
17
-
18
-
19
-
20
-
21
-
22
-
23
-
24
-
25
-
26
-
27
-
28
-
29
-
30
-
31
-
32
-
33
-
34
-
35
-
36
-
37
-
38
-
39
-
40
-
41
-
42
-
43
-
44
-
45
-
 46
46 -
 47
47 -
 48
48 -
 49
49 -
 50
50 -
 51
51 -
 52
52 -
 53
53 -
 54
54 -
 55
55 -
 56
56 -
 57
57 -
 58
58 -
 59
59 -
 60
60 -
 61
61 -
 62
62 -
 63
63 -
 64
64 -
 65
65 -
 66
66 -
67
-
68
-
69
-
70
-
71
-
72
-
73
-
74
-
75
-
76
-
77
-
78
-
79
-
80
-
81
-
82
-
83
-
84
-
85
-
86
-
87
-
88
-
89
-
90
-
91
-
92
-
93
-
94
-
95
-
96
-
97
-
98
-
99
-
100
-
101
-
102
-
103
-
104
-
105
-
106
-
107
-
108
-
109
-
110
-
111
-
112
-
113
-
114
-
115
-
116
-
117
-
118
-
119
-
120
-
121
-
122
-
123
-
124
-
125
-
126
-
127
-
128
-
129
-
130
-
131
-
132
-
133
-
134
-
135
-
136
-
137
-
138
-
139
-
140
-
141
-
142
-
143
-
144
-
145
-
146
-
147
 |
 |

34
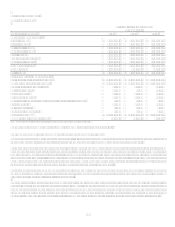
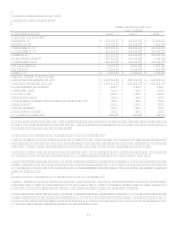
CAPITAL ONE FINANCIAL CORPORATION
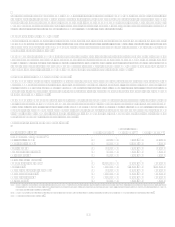
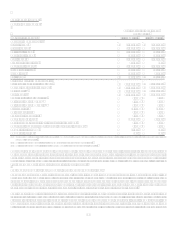
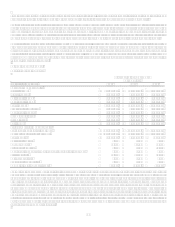
Table 1: Financial Summary
Year Ended December 31, Change
(Dollars in thousands) 2007(6) 2006(5) 2005(4) 2007 vs. 2006 2006 vs. 2005
Earnings (Reported):
Net Interest Income $ 6,529,845
$ 5,091,446 $ 3,680,242 $ 1,438,399 $ 1,411,204
Non-Interest Income:
Servicing and securitizations 4,840,677
4,209,637 3,945,183 631,040 264,454
Service charges and other customer-related fees 2,057,854
1,770,340 1,493,690 287,514 276,650
Mortgage servicing and other 166,776
177,893 142,894 (11,117) 34,999
Interchange 500,484
549,074 514,196 (48,590) 34,878
Other 488,432
294,080 262,142 194,352 31,938
Total non-interest income 8,054,223
7,001,024 6,358,105 1,053,199 642,919
Total Revenue(1) 14,584,068
12,092,470 10,038,347 2,491,598 2,054,123
Provision for loan and lease losses 2,636,502
1,476,438 1,491,072 1,160,064 (14,634)
Marketing 1,347,836
1,444,324 1,379,938 (96,488) 64,386
Restructuring expenses 138,237
138,237
Operating expenses 6,591,937
5,499,367 4,338,335 1,092,570 1,161,032
Income before taxes 3,869,556
3,672,341 2,829,002 197,215 843,339
Income taxes 1,277,837
1,245,964 1,019,855 31,873 226,109
Income from continuing operations, net of tax 2,591,719
2,426,377 1,809,147 165,342 617,230
Loss from discontinued operations, net of tax (1,021,387) (11,884) (1,009,503) (11,884)
Net Income $ 1,570,332
$ 2,414,493 $ 1,809,147 $ (844,161) $ 605,346
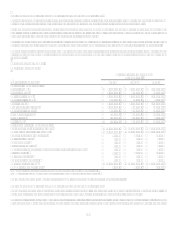
Common Share Statistics:
Basic EPS:
Income from continuing operations, net of tax $ 6.64
$ 7.84 $ 6.98 $ (1.20) $ 0.86
Loss from discontinued operations, net of tax (2.62) (0.04) (2.58) (0.04)
Net Income $ 4.02
$ 7.80 $ 6.98 $ (3.78) $ 0.82
Diluted EPS:
Income from continuing operations, net of tax $ 6.55
$ 7.65 $ 6.73 $ (1.10) $ 0.92
Loss from discontinued operations, net of tax (2.58) (0.03) (2.55) (0.03)
Net Income $ 3.97
$ 7.62 $ 6.73 $ (3.65) $ 0.89
Selected Balance Sheet Data(3):
Reported loans held for investment (period end) $ 101,805,027 $ 96,512,139 $ 59,847,681 $ 5,292,888 $ 36,664,458
Managed loans held for investment (period end) 151,362,417
146,151,268 105,527,491 5,211,149 40,623,777
Reported loans held for investment (average) 93,541,825
63,577,279 40,734,237 29,964,546 22,843,042
Managed loans held for investment (average) 144,727,006
111,328,595 85,265,023 33,398,411 26,063,572
Allowance for loan and lease losses 2,963,000
2,180,000 1,790,000 783,000 390,000
Interest bearing deposits (period end) 71,943,913
74,122,822 43,092,096 (2,178,909) 31,030,726
Total deposits (period end) 82,990,462
85,770,892 47,933,267 (2,780,430) 37,837,625
Interest bearing deposits (average) 73,980,520
45,739,027 28,370,735 28,241,493 17,368,292
Total deposits (average) $ 85,427,225
$ 50,673,434 $ 29,019,652 $ 34,753,792 $ 21,653,782
Selected Company Metrics (Reported) (3):
Return on average assets (ROA) 1.79% 2.55% 2.95% (0.76) (0.40)
Return on average equity (ROE) 10.28% 14.97% 17.08% (4.69) (2.11)
Net charge-off rate 2.10% 2.21% 3.55% (0.11) (1.34)
Net interest margin 5.38% 6.06% 6.63% (0.68) (0.57)
Revenue margin 12.01% 14.38% 18.08% (2.37) (3.70)
Selected Company Metrics (Managed) (3):
Return on average assets (ROA) 1.33% 1.70% 1.72% (0.37) (0.02)
Net charge-off rate 2.88% 2.84% 4.25% 0.04 (1.41)
Net interest margin 6.46% 6.88% 7.80% (0.42) (0.92)
Revenue margin 9.85% 10.66% 12.46% (0.81) (1.80)
(1) In accordance with the Companys finance charge and fee revenue recognition policy, the amounts billed to customers but not recognized as revenue were $1.1 billion, $0.9
billion and $1.0 billion for the years ended December 31, 2007, 2006 and 2005, respectively.
(2) Prior period amounts have been reclassified to conform with current period presentation.
(3) Based on continuing operations.
(4) On November 16, 2005, the Company acquired 100% of the outstanding common stock of Hibernia Corporation for total consideration of $5.0 billion.
(5) On December 1, 2006, the Company acquired 100% of the outstanding common stock of North Fork Bancorporation for total consideration of $13.2 billion.
(6) Discontinued operations related to the shutdown of mortgage origination operations of GreenPoints wholesale mortgage banking unit in 2007.
Summary of the Reported Income Statement
The following is a detailed description of the financial results reflected in Table 1 Financial Summary. Additional information is
provided in Section XII, Tabular Summary as detailed in sections below.