Capital One 2007 Annual Report Download - page 132
Download and view the complete annual report
Please find page 132 of the 2007 Capital One annual report below. You can navigate through the pages in the report by either clicking on the pages listed below, or by using the keyword search tool below to find specific information within the annual report.-
 1
1 -
2
-
3
-
4
-
5
-
6
-
7
-
8
-
9
-
10
-
11
-
12
-
13
-
14
-
15
-
16
-
17
-
18
-
19
-
20
-
21
-
22
-
23
-
24
-
25
-
26
-
27
-
28
-
29
-
30
-
31
-
32
-
33
-
34
-
35
-
36
-
37
-
38
-
39
-
40
-
41
-
42
-
43
-
44
-
45
-
46
-
47
-
48
-
49
-
50
-
51
-
52
-
53
-
54
-
55
-
56
-
57
-
58
-
59
-
60
-
61
-
62
-
63
-
64
-
65
-
66
-
67
-
68
-
69
-
70
-
71
-
72
-
73
-
74
-
75
-
76
-
77
-
78
-
79
-
80
-
81
-
82
-
83
-
84
-
85
-
86
-
87
-
88
-
89
-
90
-
91
-
92
-
93
-
94
-
95
-
96
-
97
-
98
-
99
-
100
-
101
-
102
-
103
-
104
-
105
-
106
-
107
-
108
-
109
-
110
-
111
-
112
-
113
-
114
-
115
-
116
-
117
-
118
-
119
-
120
-
121
-
 122
122 -
 123
123 -
 124
124 -
 125
125 -
 126
126 -
 127
127 -
 128
128 -
 129
129 -
 130
130 -
 131
131 -
 132
132 -
 133
133 -
 134
134 -
 135
135 -
 136
136 -
 137
137 -
 138
138 -
 139
139 -
 140
140 -
 141
141 -
 142
142 -
143
-
144
-
145
-
146
-
147
 |
 |

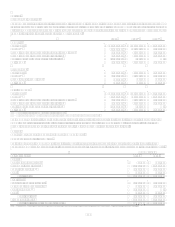
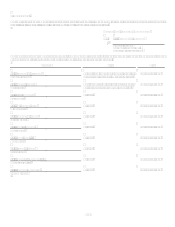
110
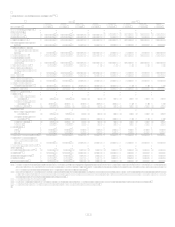
(2) As of December 31, 2007 $1.6 billion of junior subordinated debentures have been reported as other borrowings. These borrowings were classified as borrowings from
subsidiaries at December 31, 2006.
Year Ended December 31
Statements of Income 2007 2006 2005
Interest from temporary investments $ 300,394 $ 323,870 $ 201,196
Interest expense 504,708 265,585 152,531
Dividends, principally from bank subsidiaries 2,056,639 1,950,000 1,170,000
Non-interest income 12,982 4,807 371
Non-interest expense 241,660 129,491 27,065
Income before income taxes and equity in undistributed earnings of subsidiaries 1,623,647 1,883,601 1,191,971
Income tax (benefit) expense (245,052) (67,653) 5,032
Equity in undistributed earnings of subsidiaries 723,020 475,123 622,208
Income from continuing operations, net of tax 2,591,719 2,426,377 1,809,147
Loss from discontinued operations, net of tax (1,021,387) (11,884)
Net income $ 1,570,332 $ 2,414,493 $ 1,809,147
Year Ended December 31
Statements of Cash Flows 2007 2006 2005
Operating Activities:
Net income $ 1,570,332 $ 2,414,493 $ 1,809,147
Adjustments to reconcile net income to net cash provided by operating activities:
Equity in (earnings) loss of subsidiaries
Continuing operations (723,020) (475,123) (622,208)
Discontinued operations 1,021,387 11,884
Loss on sale of securities available for sale 223
Loss on repurchase of senior notes 12,444
Amortization of discount of senior notes 7,293 1,347 2,818
Stock plan compensation expense 301,972 212,317 149,496
(Increase) decrease in other assets (216,052) 19,159 212,019
Increase (decrease) in other liabilities 522,714 (448,363) 43,452
Net cash provided by operating activities 2,484,849 1,735,714 1,607,168
Investing Activities:
Decrease (increase) in investment in subsidiaries 969,122 68,953 (911,348)
Purchases of securities available for sale (127) (52,686)
Proceeds from sale of securities available for sale 53,569
(Increase) decrease in loans to subsidiaries (1,930,666) (1,065,622) 115,952
Net cash used for acquisitions (10,464) (5,010,821) (2,261,757)
Net cash used in investing activities (918,566) (6,060,176) (3,057,153)
Financing Activities:
Increase (decrease) in borrowings from subsidiaries 166,876 1,379,497 (81,463)
Issuance of senior notes 1,495,740 3,185,588 1,262,035
Maturities of senior notes (462,500) (225,000) (162,500)
Repurchases of senior notes (150,000) (597,196)
Dividends paid (42,055) (32,324) (27,504)
Purchases of treasury stock (3,024,969) (21,615) (40,049)
Net proceeds from issuances of common stock 43,493 36,751 770,311
Proceeds from share based payment activities 192,361 238,355 312,176
Net cash (used in) provided by financing activities (1,781,054) 4,561,252 1,435,810
(Decrease) increase in cash and cash equivalents (214,771) 236,790 (14,175)
Cash and cash equivalents at beginning of year 239,473 2,683 16,858
Cash and cash equivalents at end of year $ 24,702 $ 239,473 $ 2,683