Capital One 2007 Annual Report Download - page 112
Download and view the complete annual report
Please find page 112 of the 2007 Capital One annual report below. You can navigate through the pages in the report by either clicking on the pages listed below, or by using the keyword search tool below to find specific information within the annual report.-
 1
1 -
2
-
3
-
4
-
5
-
6
-
7
-
8
-
9
-
10
-
11
-
12
-
13
-
14
-
15
-
16
-
17
-
18
-
19
-
20
-
21
-
22
-
23
-
24
-
25
-
26
-
27
-
28
-
29
-
30
-
31
-
32
-
33
-
34
-
35
-
36
-
37
-
38
-
39
-
40
-
41
-
42
-
43
-
44
-
45
-
46
-
47
-
48
-
49
-
50
-
51
-
52
-
53
-
54
-
55
-
56
-
57
-
58
-
59
-
60
-
61
-
62
-
63
-
64
-
65
-
66
-
67
-
68
-
69
-
70
-
71
-
72
-
73
-
74
-
75
-
76
-
77
-
78
-
79
-
80
-
81
-
82
-
83
-
84
-
85
-
86
-
87
-
88
-
89
-
90
-
91
-
92
-
93
-
94
-
95
-
96
-
97
-
98
-
99
-
100
-
101
-
 102
102 -
 103
103 -
 104
104 -
 105
105 -
 106
106 -
 107
107 -
 108
108 -
 109
109 -
 110
110 -
 111
111 -
 112
112 -
 113
113 -
 114
114 -
 115
115 -
 116
116 -
 117
117 -
 118
118 -
 119
119 -
 120
120 -
 121
121 -
 122
122 -
123
-
124
-
125
-
126
-
127
-
128
-
129
-
130
-
131
-
132
-
133
-
134
-
135
-
136
-
137
-
138
-
139
-
140
-
141
-
142
-
143
-
144
-
145
-
146
-
147
 |
 |

90
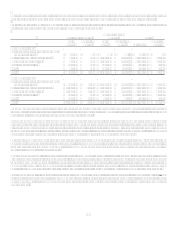
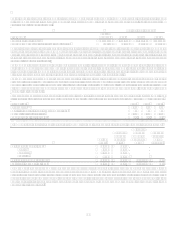
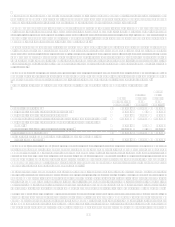
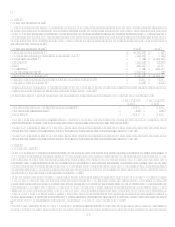
Assumed health care cost trend rates have a significant effect on the amounts reported for the other postretirement benefit plans. A
one-percentage point change in assumed health care cost trend rates would have the following effects:
2007 2006
1% Increase 1% Decrease 1% Increase 1% Decrease
Effect on year-end postretirement benefit obligation $ 5,684 $ (4,817) $ 9,393 $ (7,768)
Effect on total service and interest cost components $ 1,780 $ (1,459) $ 2,014 $ (1,595)
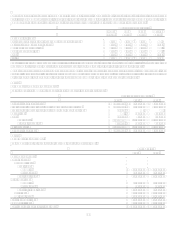
Plan Assets
The qualified defined benefit pension plan asset allocations as of the annual measurement dates are as follows:
2007 2006
Equity securities 70% 60%
Debt securities 30% 38%
Other 2%
Total 100% 100%
The investment guidelines provide the following asset allocation targets and ranges: domestic equity target of 50% and allowable
range of 45% to 55%, international equity target of 20% and allowable range of 15% to 25%, and domestic debt securities target of
30% and allowable range of 25% to 40%.
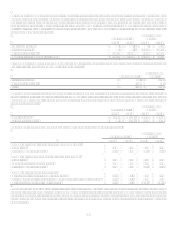
Expected future benefit payments
The following benefit payments, which reflect expected future service, as appropriate, are expected to be paid:
Pension
Benefits Postretirement
Benefits
2008 $ 30,121 $ 3,239
2009 15,947 3,634
2010 15,101 4,009
2011 15,097 4,390
2012 16,141 4,588
2013 - 2017 70,883 26,364
In 2008, $0.9 million in contributions are expected to be made to the pension plans, and $3.2 million in contributions are expected to
be made to the other postretirement benefit plans.
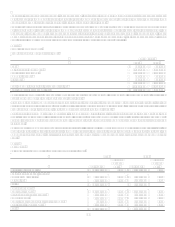
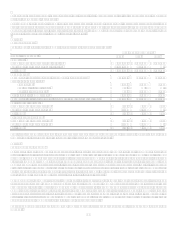
Note 13
Other Non-Interest Expense
Year Ended December 31
2007 2006 2005
Professional services $ 772,022
$ 681,535 $ 490,617
Collections 560,075
525,680 537,772
Fraud losses 123,028
103,010 53,744
Bankcard association assessments 181,076
166,512 136,318
Core deposit intangible amortization 212,107
84,078
Other 538,527
325,820 281,330
Total $ 2,386,835 $ 1,886,635 $ 1,499,781
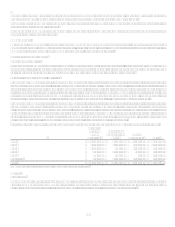
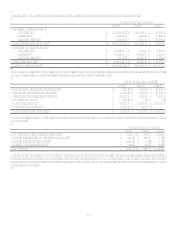
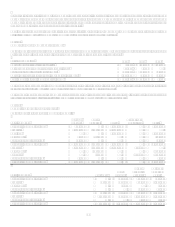
Note 14
Income Taxes
The Company accounts for income taxes in accordance with SFAS No. 109, Accounting for Income Taxes, recognizing the current and
deferred tax consequences of all transactions that have been recognized in the consolidated financial statements using the provisions of
the enacted tax laws. Deferred tax assets and liabilities are determined based on differences between the financial reporting and tax
bases of assets and liabilities and are measured using the enacted tax rates and laws that will be in effect when the differences are
expected to reverse. Valuation allowances are recorded to reduce deferred tax assets to an amount that is more likely than not to be
realized.